5 Data Analytics Strategies That Actually Drive Revenue Growth
Companies leveraging customer analytics are 23% more profitable. This guide covers the five proven analytics strategies — CLV modeling, churn prediction, dynamic pricing, attribution modeling, and operational optimization — with implementation frameworks and real-world results.


- Data-driven companies are 23% more profitable and 6x more likely to achieve profitability targets.
- Marketing teams using advanced analytics report 28% faster revenue growth and 31% improvement in campaign ROI.
- Predictive churn models achieve 70–85% accuracy and can reduce customer attrition by 18% or more.
- AI-powered attribution models improve campaign performance by an average of 27%.
- Over 90% of organizations report measurable value from analytics investments when implemented strategically.
The Analytics Revenue Gap
Most enterprises have invested in dashboards and reporting tools. Fewer have implemented analytics strategies that directly impact the bottom line. The gap between "having data" and "generating revenue from data" is where strategic analytics consulting creates the most value.
The global data analytics market is projected to reach $108.79 billion in 2025 and expand to $785.62 billion by 2035, underscoring the enterprise-wide recognition that data analytics is no longer a support function — it's a core revenue driver.
Over 400+ engagements across 18 industries, these are the five analytics strategies that consistently deliver measurable revenue growth for our clients.
Strategy 1: Customer Lifetime Value (CLV) Modeling
The Business Case
CLV modeling predicts the total revenue a customer will generate across their entire relationship with your organization. This transforms customer acquisition from a cost center into a strategic investment — enabling teams to allocate budget toward acquiring and retaining their most valuable customer segments.
Research indicates that companies utilizing advanced CLV analytics can achieve a 20% increase in profitability. Predictive CLV models can forecast individual customer value within 15–20% accuracy, enabling data-driven decisions on acquisition spend, retention investment, and personalization intensity.
Implementation Framework
- Start with RFM segmentation (Recency, Frequency, Monetary) — achievable in 1–2 days using SQL or Python
- Build probabilistic CLV models using BG/NBD + Gamma-Gamma methodology for non-contractual businesses
- Operationalize by integrating CLV scores into CRM systems via reverse ETL (Census, Hightouch) for real-time activation
- Measure impact through A/B tested acquisition campaigns comparing CLV-informed targeting vs. baseline
Client Result
For a DTC e-commerce brand, implementing CLV-based audience segmentation and spend allocation increased marketing ROI by 35% within 90 days by shifting budget from low-value acquisition to high-value retention campaigns.
Strategy 2: Predictive Churn Prevention
The Business Case
Customer acquisition costs 5–7x more than retention. Predictive churn models use machine learning to identify at-risk customers 30–90 days before they actually leave, providing intervention windows that dramatically improve retention economics.
Modern churn prediction models achieve 70–85% accuracy, and targeted re-engagement campaigns driven by these models have been shown to reduce churn by 18% on average. For subscription businesses, a 5% improvement in retention can increase profitability by 25–95%.
Implementation Framework
- Define churn criteria specific to your business model (inactivity period, subscription cancellation, revenue decline)
- Feature engineering — usage frequency, support ticket velocity, engagement decay rate, payment delays, NPS scores
- Model selection — gradient-boosted trees (XGBoost, LightGBM) consistently outperform for churn prediction due to their handling of mixed feature types
- Deployment — automated weekly scoring integrated with marketing automation for triggered intervention workflows
Client Result
A B2B SaaS client reduced churn by 22% within six months by deploying a gradient-boosted model scoring customers weekly and triggering automated retention offers (personalized discounts, dedicated CSM outreach, feature adoption campaigns).
Strategy 3: Dynamic Pricing Analytics
The Business Case
Static pricing leaves revenue on the table. Dynamic pricing analytics uses demand patterns, competitor data, inventory levels, and customer willingness-to-pay signals to optimize pricing in near-real-time. This is one of the highest-ROI analytics investments — with typical implementations delivering 5–15% revenue uplift within the first quarter.
Implementation Framework
- Price elasticity analysis — quantify how demand changes at different price points for each product/segment
- Competitive monitoring — automated scraping or third-party feeds (Competera, Prisync) tracking competitor pricing daily
- Optimization model — constrained optimization balancing revenue, margin, and inventory targets
- Guardrails — minimum margins, maximum price change frequency, and fairness constraints to prevent customer backlash
Client Result
An e-commerce brand increased average order value by 18% by implementing data-driven pricing tiers based on time-of-day demand patterns, real-time inventory levels, and customer segment willingness-to-pay.
Strategy 4: Multi-Touch Attribution Modeling
The Business Case
Last-click attribution is misleading and systematically undervalues top-of-funnel activity. Multi-touch attribution and marketing mix modeling reveal the true incremental impact of each marketing channel, enabling more efficient budget allocation. AI-powered attribution models improve campaign performance by an average of 27%.
With the deprecation of third-party cookies and increasing privacy regulations, first-party data strategies and privacy-compliant measurement frameworks are becoming essential for accurate attribution in 2026.
Implementation Framework
- Data foundation — unified customer journey tracking across all touchpoints (web, email, ads, social, offline)
- Model selection — Shapley-value attribution for digital channels, marketing mix modeling (MMM) for including offline and brand spend
- Incrementality testing — geo-holdout tests and synthetic control experiments to validate attribution model outputs
- Activation — automated budget reallocation recommendations fed into campaign management platforms
Client Result
A B2B SaaS company discovered that 40% of Google Ads spend was driving clicks from users who would have converted organically. Reallocating that budget to top-of-funnel content marketing increased qualified pipeline by 28% without increasing total marketing spend.
Strategy 5: Operational Efficiency Analytics
The Business Case
Operational analytics identifies and eliminates waste across supply chain, workforce, and process operations. AI-driven supply chain analytics alone can reduce costs by up to 15% while simultaneously increasing service levels by 10%. For organizations with complex operations, the ROI typically exceeds 3x within the first year.
Implementation Framework
- Process mining — analyze event logs to identify bottlenecks, rework loops, and deviations from optimal workflows
- Demand forecasting — time-series models (Prophet, ARIMA, LSTM) for workforce planning, inventory optimization, and capacity allocation
- Real-time monitoring — operational dashboards with automated alerting for SLA breaches and anomalous patterns
- Continuous optimization — feedback loops that refine models based on actual vs. predicted outcomes
Client Result
A logistics provider reduced delivery costs by 23% by analyzing route efficiency, driver performance, traffic patterns, and loading optimization data to redesign scheduling and routing algorithms.
Prioritization Framework
Not every strategy is right for every organization. We recommend prioritizing based on two dimensions: revenue impact potential and data readiness.
- High data readiness + high impact: Start with CLV modeling or churn prediction — these require customer transaction data that most organizations already collect.
- Lower data readiness + high impact: Attribution modeling and dynamic pricing require more data infrastructure but deliver outsized returns.
- Quick wins: Operational efficiency analytics often reveals immediate savings that fund more complex initiatives.
Over 90% of organizations report measurable value from analytics investments when implemented strategically. The key is starting with a clearly defined business outcome, not a technology initiative.
Ready to identify which strategies will drive the highest ROI for your business? Book a free 30-minute consultation with our analytics strategy team.
Written by Ali Raza
Founder & CEO at Alfa Analytics
Helping enterprises turn data into revenue. Expert in data engineering, BI dashboards, and analytics strategy across 18+ industries.
Ready to transform your data into results?
Our team has delivered 400+ analytics projects across 18 industries. Book a free 30-minute consultation to discuss how we can help.
More from Alfa Analytics

Compute Is the New Oil: Here Is the Proof
The four largest hyperscalers are projected to spend $765 billion on AI infrastructure in 2026, and BlackRock is already calling compute the next crude oil futures market. This post breaks down the economic, geopolitical, and strategic proof that compute has crossed from utility to critical resource, and what that means for how you plan your technology investments.
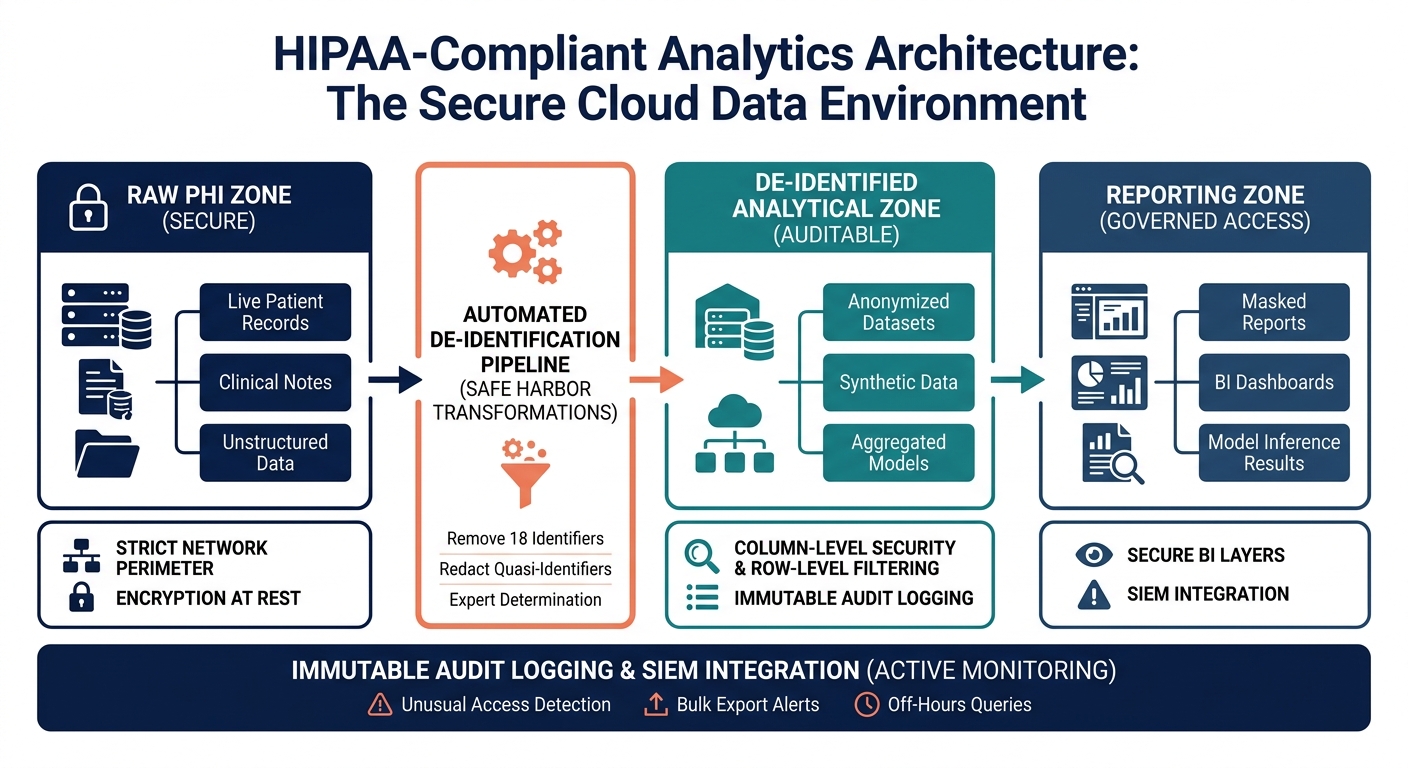
HIPAA-Compliant Analytics: Architecting Secure Cloud Data Environments for Healthcare
Building analytics infrastructure on patient data requires more than signing a Business Associate Agreement with your cloud provider. This guide covers the architectural decisions, de-identification techniques, and compliance controls that separate a genuinely secure healthcare data environment from one that only looks compliant on paper.