Ecommerce RFM Dashboard: Identified $50k in Churn Risks
Key Measurable Results
Churn risk flagged in customers who used to buy but went quiet
Sales identified from top Champion customers alone
693 customers grouped for targeted loyalty & win-back offers
1The Problem
The business had 693 customers but no clear way to tell them apart. Everyone got the same emails and offers—whether they bought every week or hadn't ordered in almost a year. There was no quick way to see who the best customers were or who had stopped buying.
2What We Built
Built an interactive RFM segmentation dashboard in Tableau that scores all 693 customers on how recently they bought (Recency), how often they buy (Frequency), and how much they spend (Monetary), mapping every customer into 11 actionable segments.
The Tools & How We Used Them
Data Preparation
Cleaned raw order history and calculated three core metrics for every customer before loading into Tableau: days since last purchase, total order count, and lifetime spend.
RFM Scoring Engine (1–5)
Assigned each customer a 1-to-5 score for Recency, Frequency, and Monetary value, mapping combinations into 11 segments including Champions, Loyal, Potential Loyalist, Need Attention, At Risk, Cannot Lose Them, Hibernating, and Lost.
Tableau Interactive Dashboard
Surfaces headline KPIs (693 customers, 87-day average recency, 6.6 orders per customer, $3,013 average spend) alongside segment sales bars, order histograms, and frequency-vs-recency bubble charts.
RFM Heatmap & Drill Filters
Visualizes customer concentration across every R, F, and M score combination with instant filters so the marketing team can isolate any cohort for targeted campaigns.
How It Works — Step by Step
Cleaned raw order history and computed days since last order, total order count, and lifetime spend for all 693 customers
Scored every customer from 1 to 5 across Recency, Frequency, and Monetary value
Mapped score combinations into 11 clear segments from Champions (99 customers) to At Risk (101) and Hibernating (84)
Built the interactive Tableau dashboard with segment sales rankings, recency distributions, and an R×F×M heatmap
Enabled one-click segment and score filtering so the team can export lists for loyalty rewards vs. win-back offers
✓The Result
Churn risk flagged in customers who used to buy but went quiet
Sales identified from top Champion customers alone
693 customers grouped for targeted loyalty & win-back offers
See this workflow in action
View Video Transcript
[00:00] [Upbeat instrumental music] The business had 693 customers but no clear way to tell them apart. [00:03] Ecommerce RFM Dashboard: Identified $50k in Churn Risks. Built an interactive RFM segmentation dashboard in Tableau that scores all 693 customers on how recently they bought (Recency), how often they buy (Frequency), and how much they spend (Monetary), mapping every customer into 11 actionable segments. [00:07] How it works: Cleaned raw order history and computed days since last order, total order count, and lifetime spend for all 693 customers Scored every customer from 1 to 5 across Recency, Frequency, and Monetary value [00:12] Measured output: $50K — Churn risk flagged in customers who used to buy but went quiet. $185K — Sales identified from top Champion customers alone. [00:17] Live production build powered by Tableau, RFM Analysis, Data Engineering, Customer Segmentation, Churn Analysis. [00:19] [Music fades out] Delivered in 3 weeks by Alfa Analytics.
Skills & Deliverables
Project Details
Our Role
Senior Analyst
Client
Ecommerce Brand
Industry
E-Commerce & DTC
Delivery Timeline
3 weeks
Related Services
Need a similar system built for your team?
Book a free discovery call and we'll map out how to build this for your exact data sources and tools.
More E-Commerce & DTC Case Studies
View All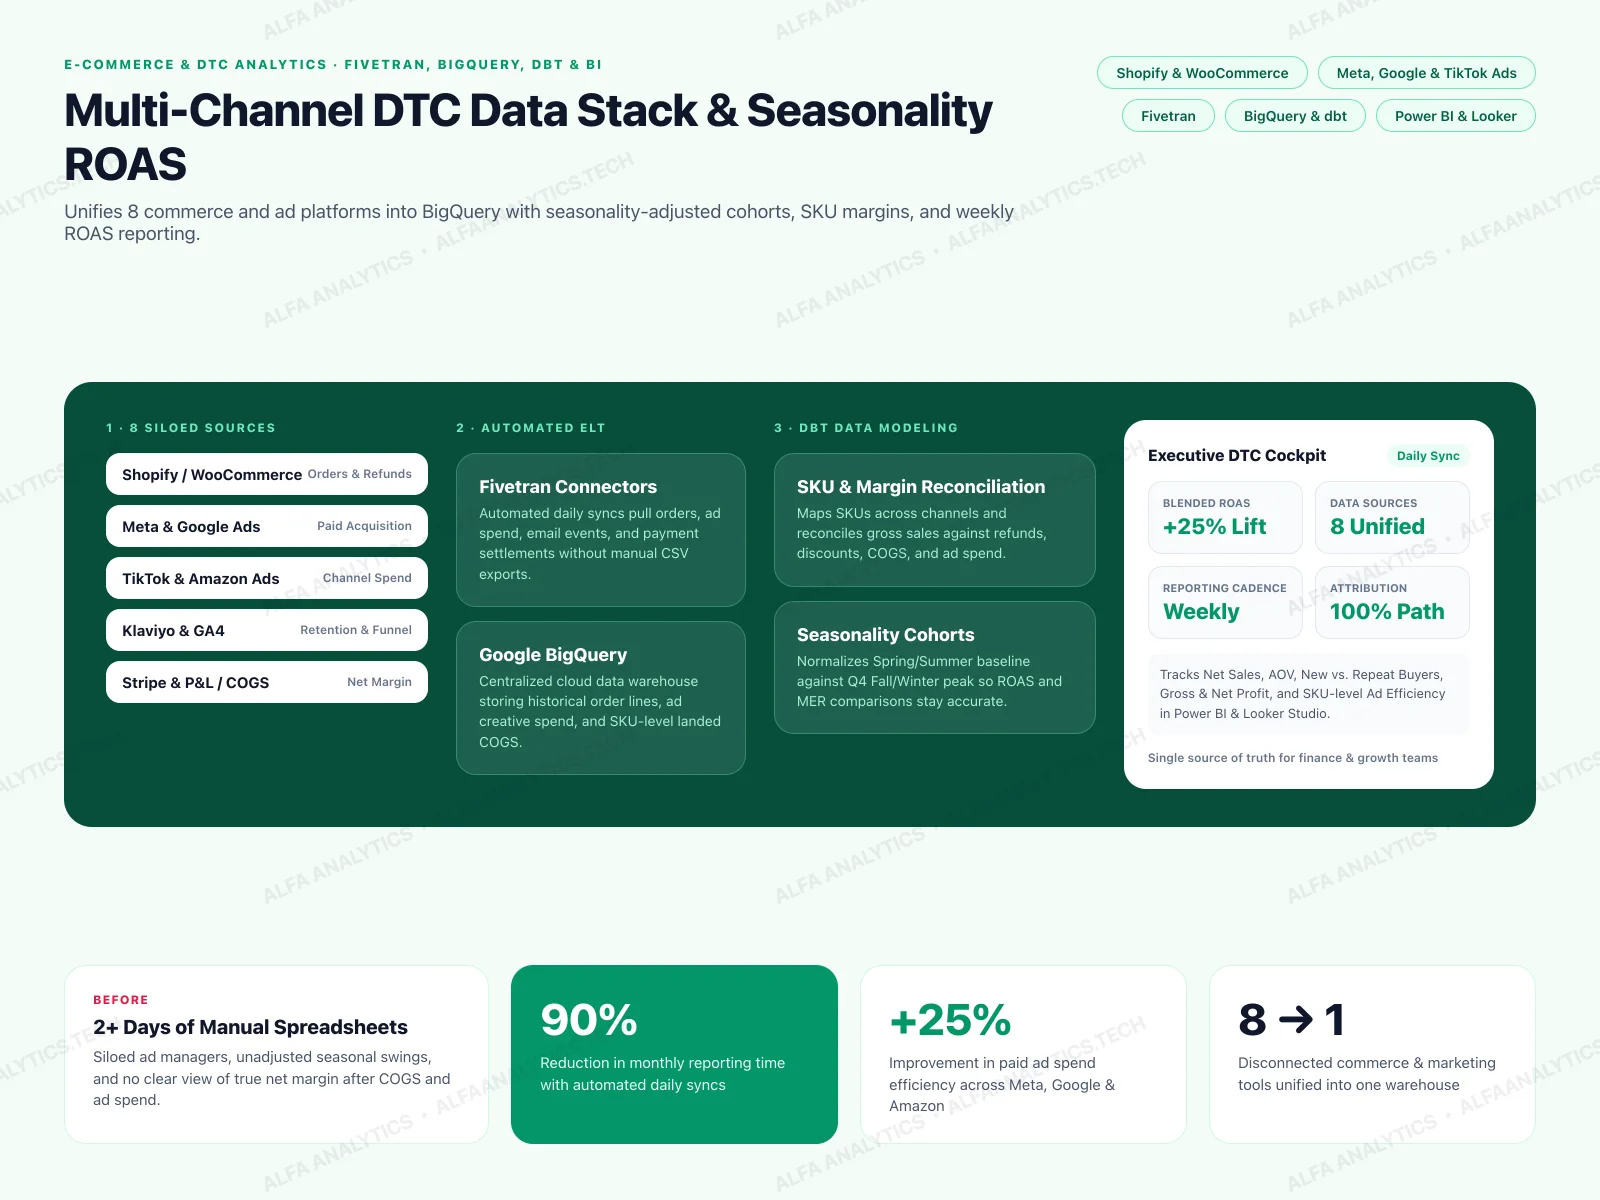
Multi-Channel DTC Data Stack & Seasonality ROAS Analytics
The brand was selling on Shopify/WooCommerce and running paid ads across Meta, Google, TikTok, and Amazon, with email in Klaviyo and payments in Stripe. Data was siloed across 8 platforms, manual reporting took 2+ days every month, and leadership couldn't account for seasonal swings when evaluating ROAS or true net margin.
View Case Study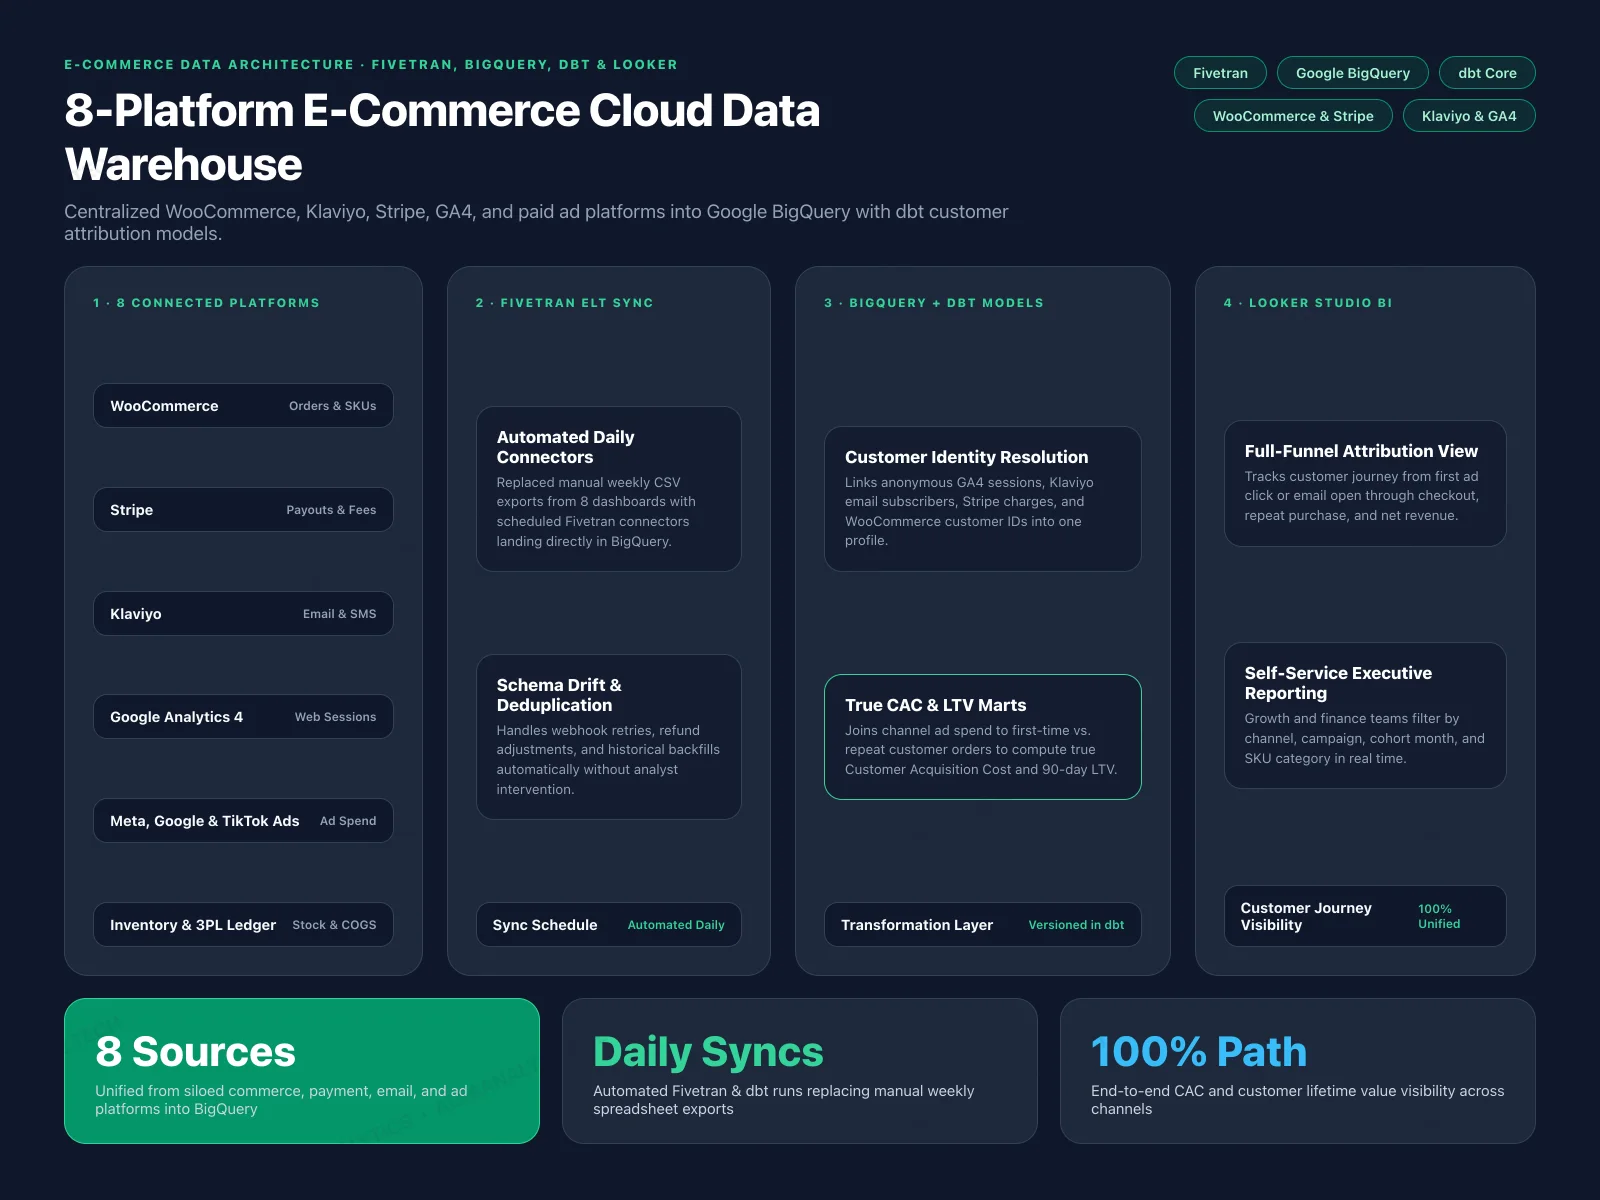
E-Commerce Data Architecture: 8-Platform BigQuery & dbt Stack
Data was siloed across 8 different platforms (WooCommerce, Meta Ads, TikTok Ads, Google Ads, GA4, Klaviyo, Stripe, and ERP inventory) with no way to see the complete customer journey or calculate true customer acquisition cost.
View Case Study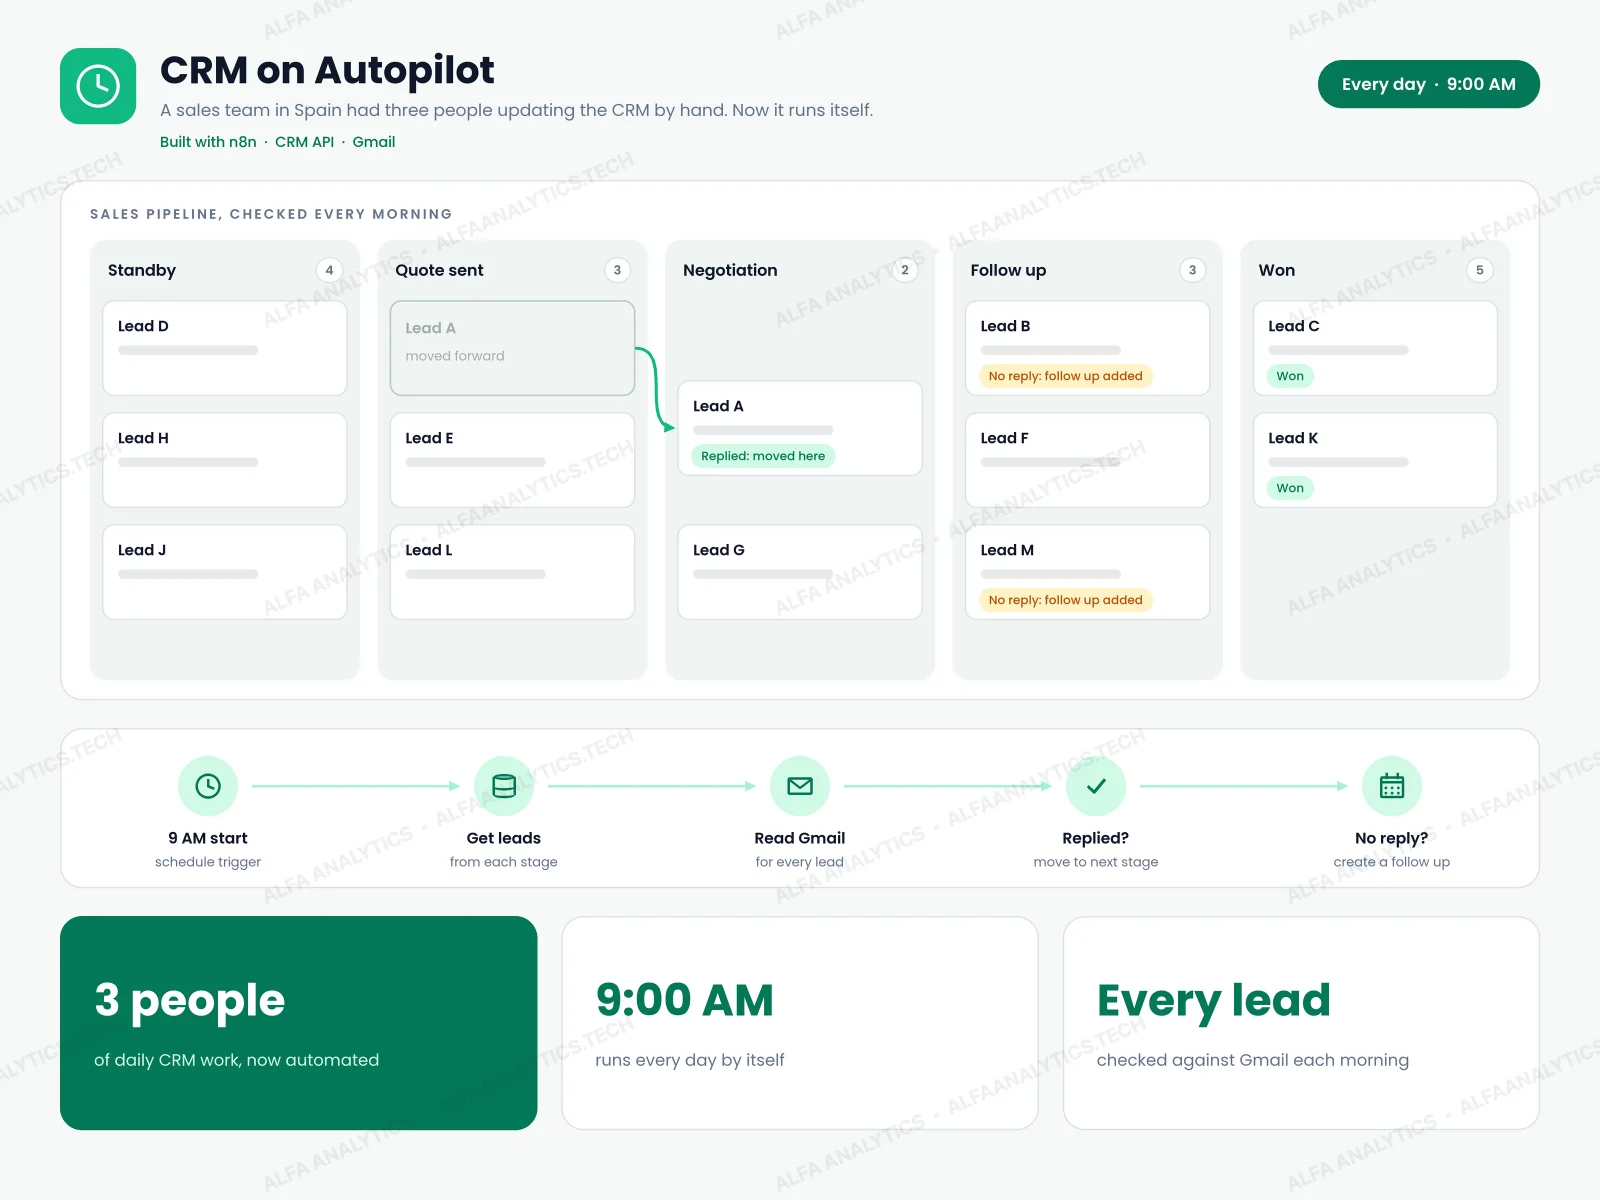 Video
CRM on Autopilot: Daily Lead Pipeline Automation
A sales team in Spain was running its entire pipeline by hand. Three people spent their days inside the CRM: checking Gmail to see who had replied, moving leads from one stage to the next, setting follow-up reminders, and fixing contact records. It was slow, error-prone, and the only way to handle more leads was to hire more people.
View Case Study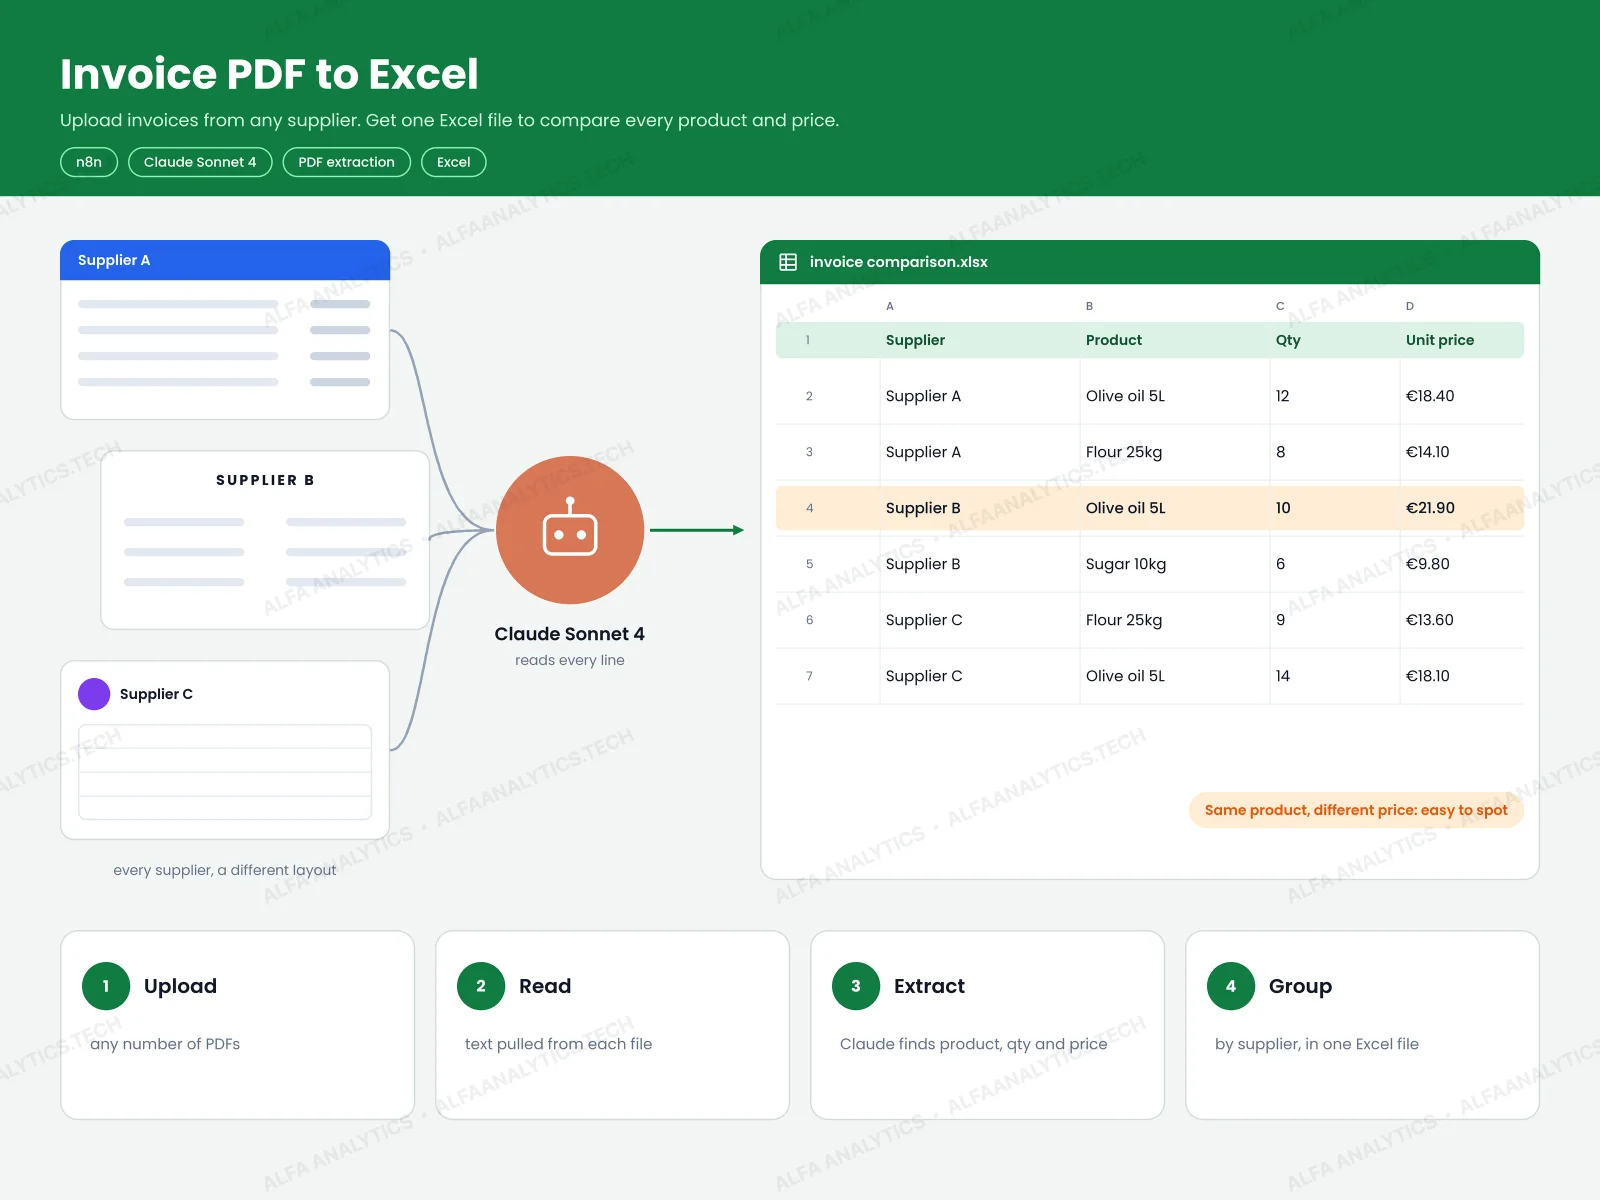 Video
AI Invoice PDF to Excel Comparison Tool
The client received invoices from many different suppliers, and every supplier used a different PDF layout. To compare product unit prices or catch billing errors, someone had to type every line item into a spreadsheet by hand—which was slow and made price changes easy to miss.
View Case Study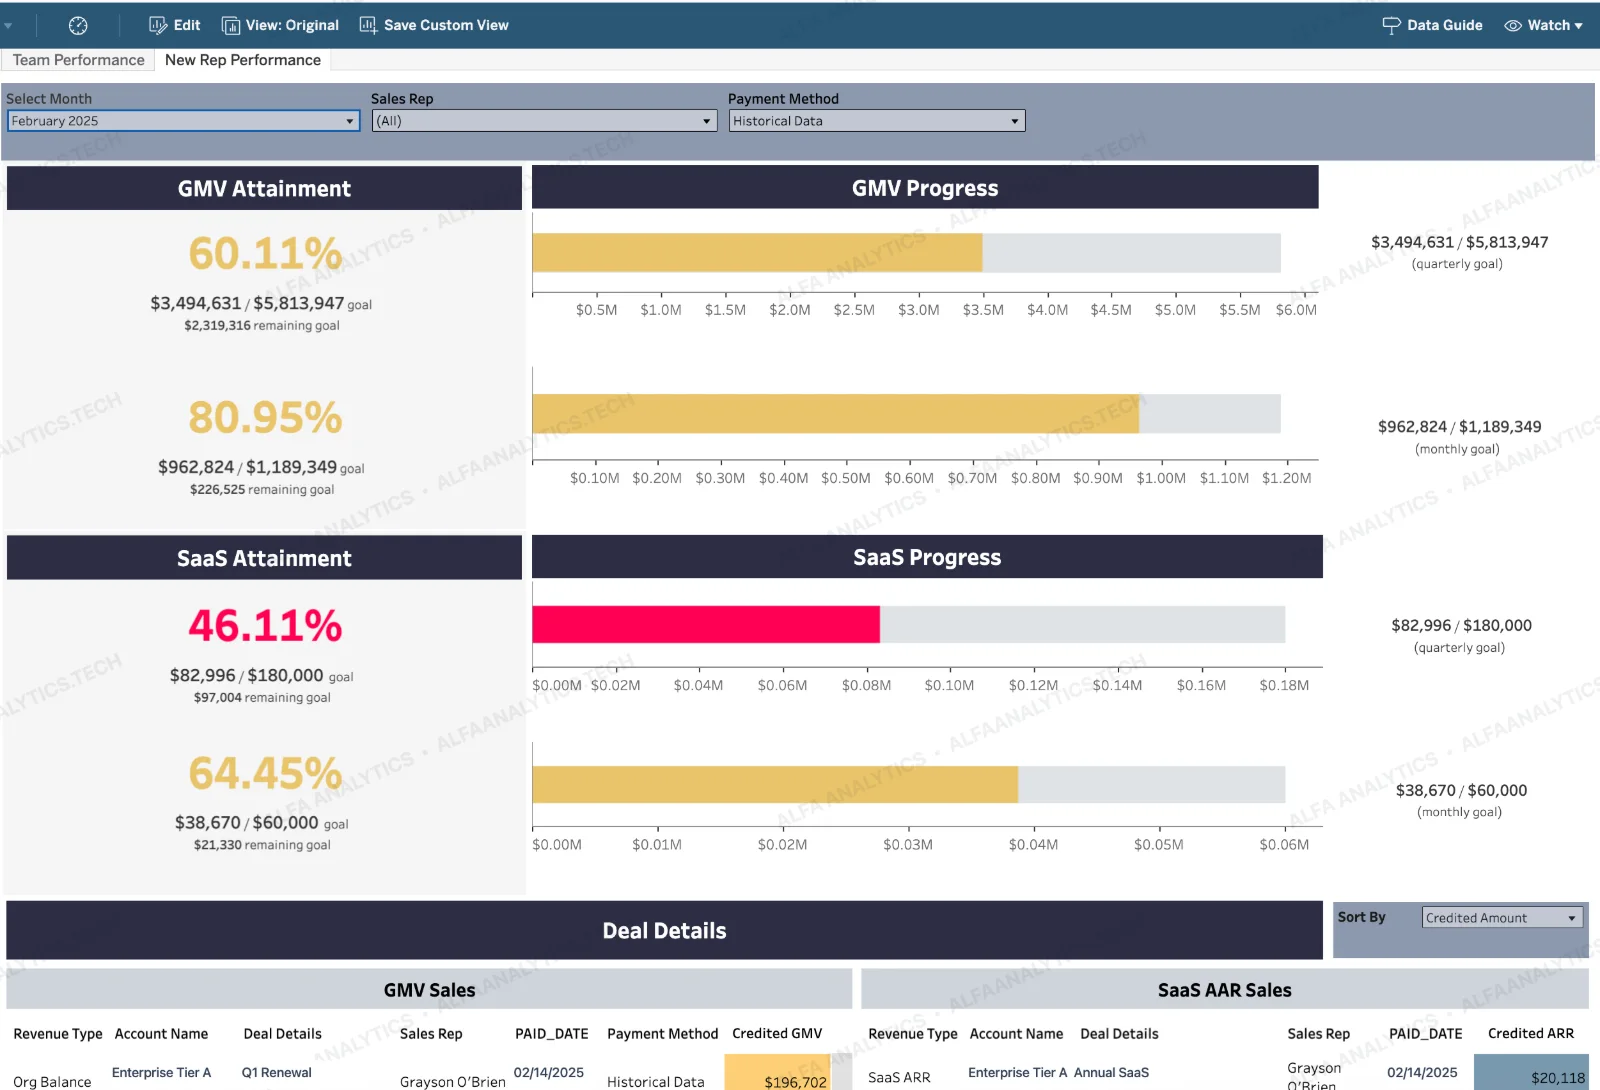
GMV & SaaS ARR Sales Performance Tracker
Sales leadership couldn't track real-time progress toward quarterly and monthly GMV and SaaS ARR targets. Pipeline forecasting lived in manual spreadsheets with no rep-level deal visibility.
View Case Study