Seasonality-Aware DTC Performance Analytics
Key Results
Reduction in monthly reporting time
Insights delivery (from monthly)
Improvement in ad spend efficiency
1The Challenge
The brand was running paid ads across Shopify, Meta, Google, and Amazon but had no unified view of performance. Manual reporting took 2+ days monthly, and they couldn't account for seasonality when evaluating ROAS.
2Our Solution
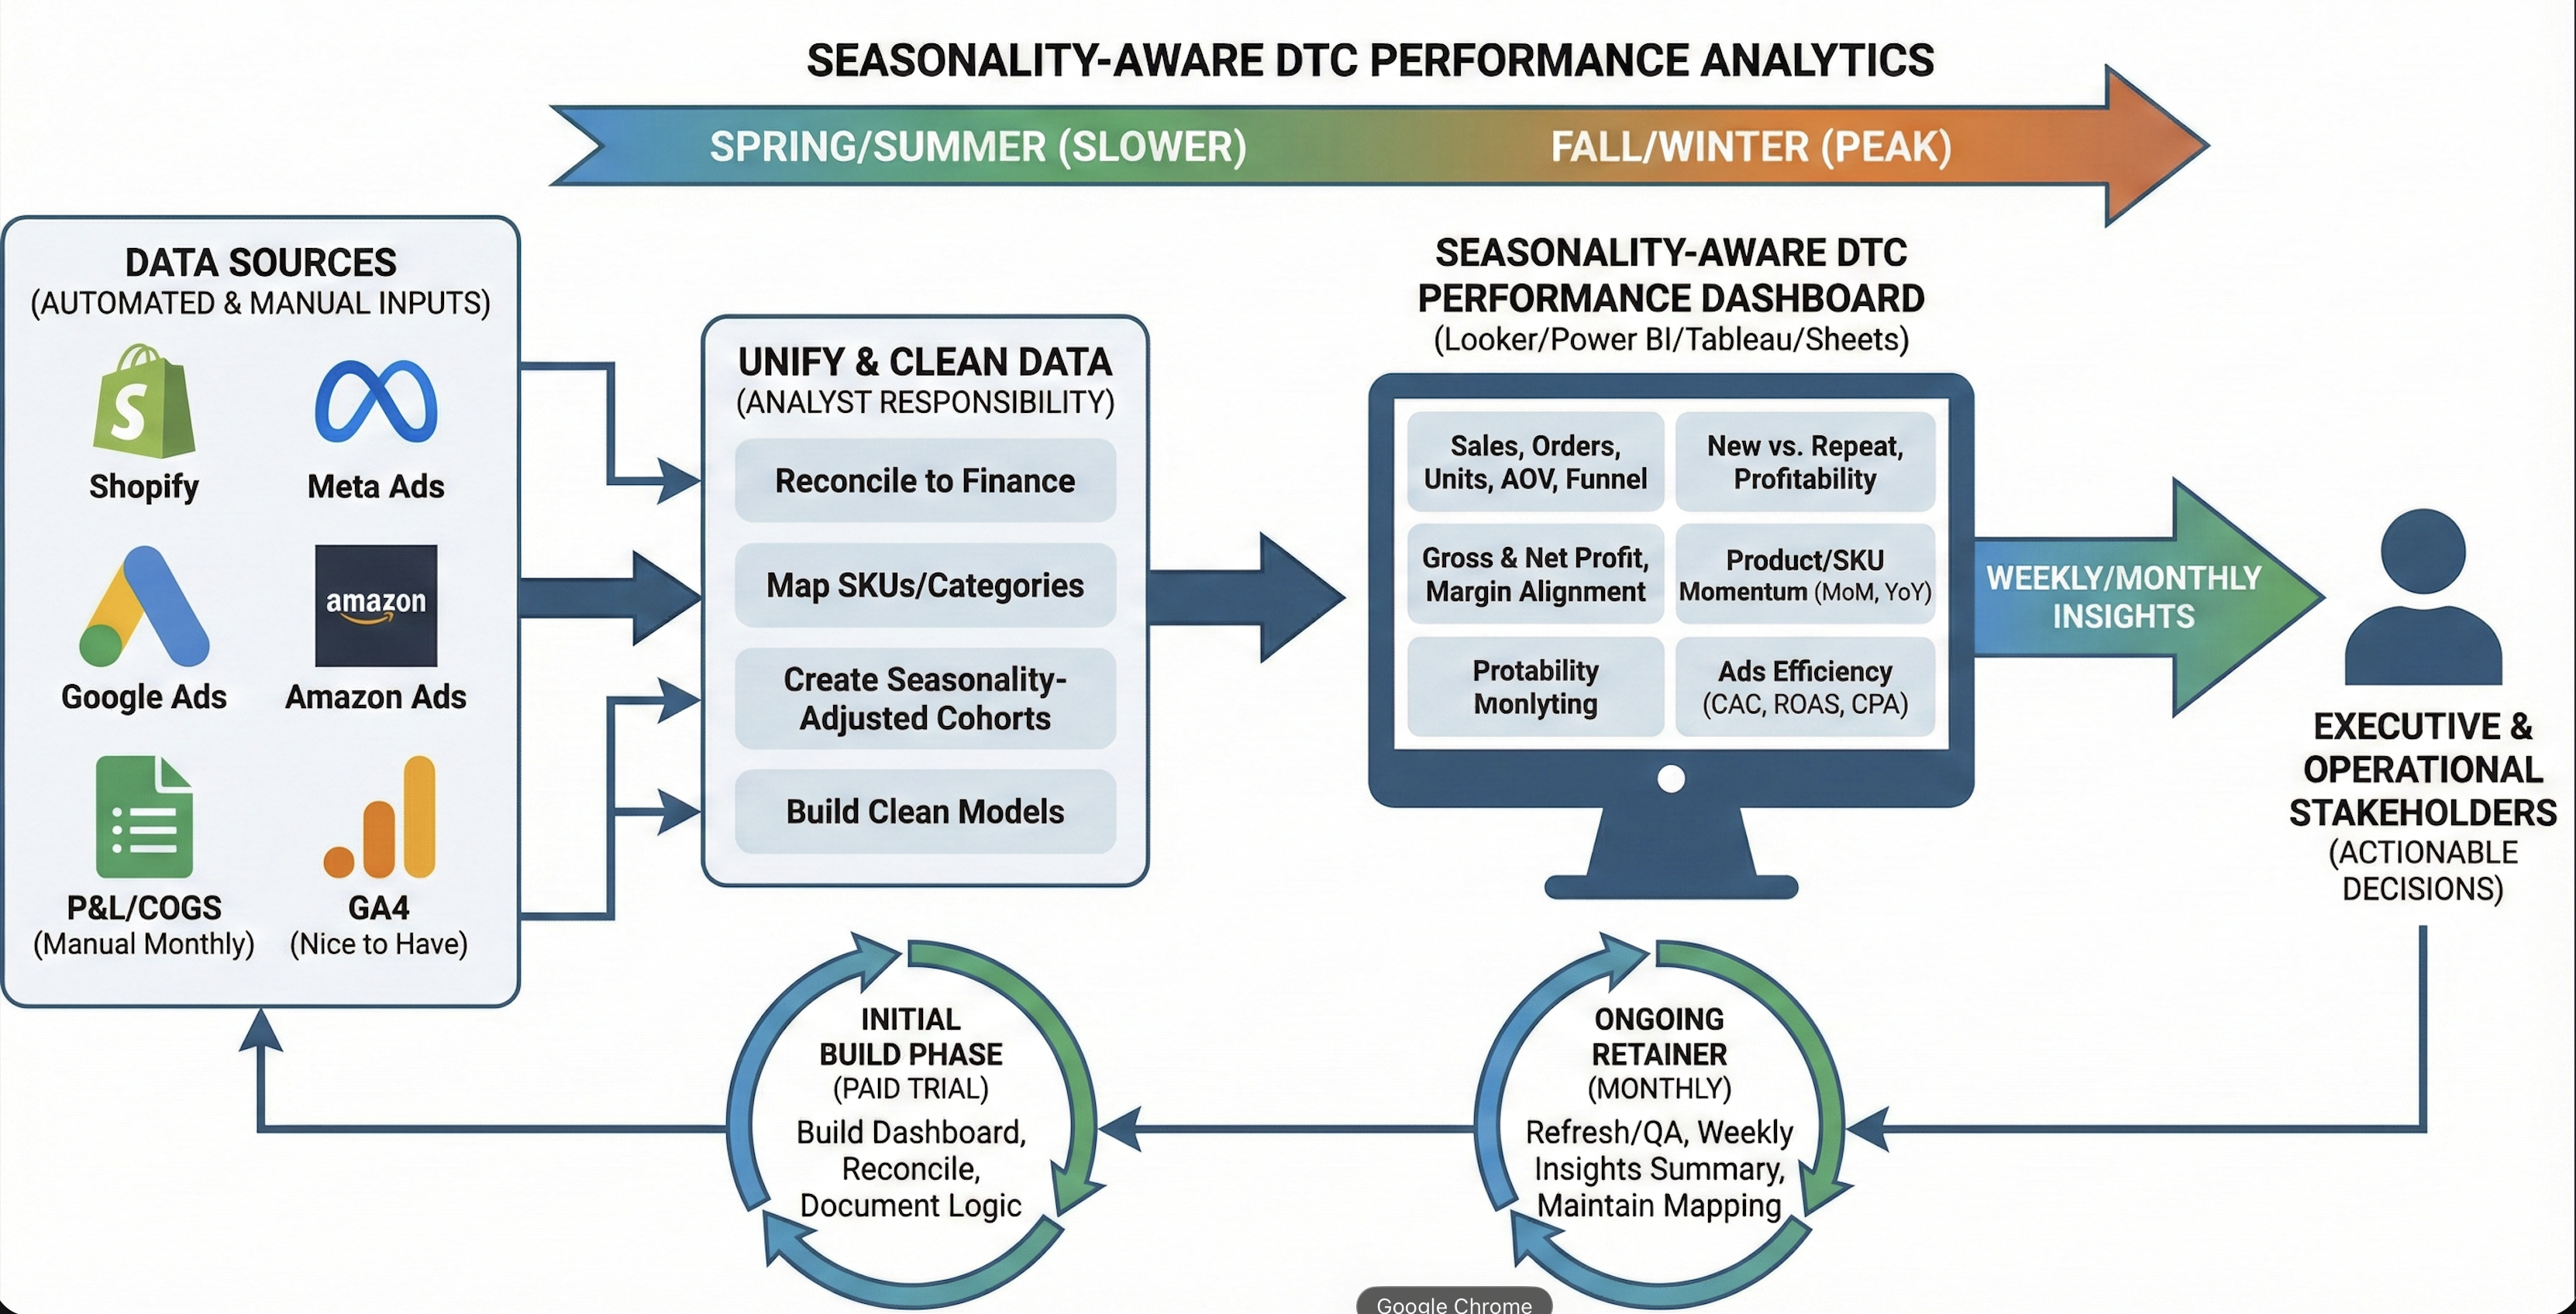
Designed a comprehensive analytics system that unifies data from all sales and advertising channels, normalizes for seasonality (Spring/Summer vs Fall/Winter peak), and provides weekly actionable insights to executive and operational stakeholders.
Our Approach
Mapped all data sources: Shopify, Meta Ads, Google Ads, Amazon Ads, GA4, and P&L data
Built data unification layer with analyst-managed SKU mapping and category reconciliation
Created seasonality-adjusted cohorts for accurate year-over-year comparisons
Designed dashboard showing Sales, Orders, AOV, Funnel metrics, Gross & Net Profit, and Ad Efficiency
Established ongoing retainer for weekly insights summaries and dashboard maintenance
✓The Impact
Reduction in monthly reporting time
Insights delivery (from monthly)
Improvement in ad spend efficiency
Technology Stack
Project Details
Client
Multi-Channel D2C Brand
Industry
E-Commerce & DTC
Duration
4 weeks initial + ongoing retainer
Want to achieve similar results for your e-commerce & dtc organization?
More E-Commerce & DTC Projects
RFM Customer Segmentation Dashboard
The marketing team was sending the same email campaigns to all 693 customers with no personalization. They had no visibility into who their best customers were, who was at risk of churning, or how to prioritize retention efforts.
View Case StudyE-Commerce Data Architecture
Data was siloed across 8 different platforms (WooCommerce, FB Ads, TikTok Ads, Google Ads, GA4, Klaviyo, Stripe, Undergoods) with no way to see the complete customer journey or calculate true customer acquisition cost.
View Case Study