Zakat Foundation Global Impact Dashboard
Key Results
People supported worldwide (tracked in real-time)
Zakat Income visualized for transparency
Year-over-year growth in people helped
1The Challenge
The foundation needed to communicate their global impact to donors but had no way to visualize where donations were coming from, how funds were being distributed, and the growing need for support across regions.
2Our Solution
Designed a beautiful public-facing impact dashboard showing global donation sources, fund distribution, people helped over time, and the story of growing need. Dashboard serves as both internal reporting tool and donor communication asset.
Our Approach
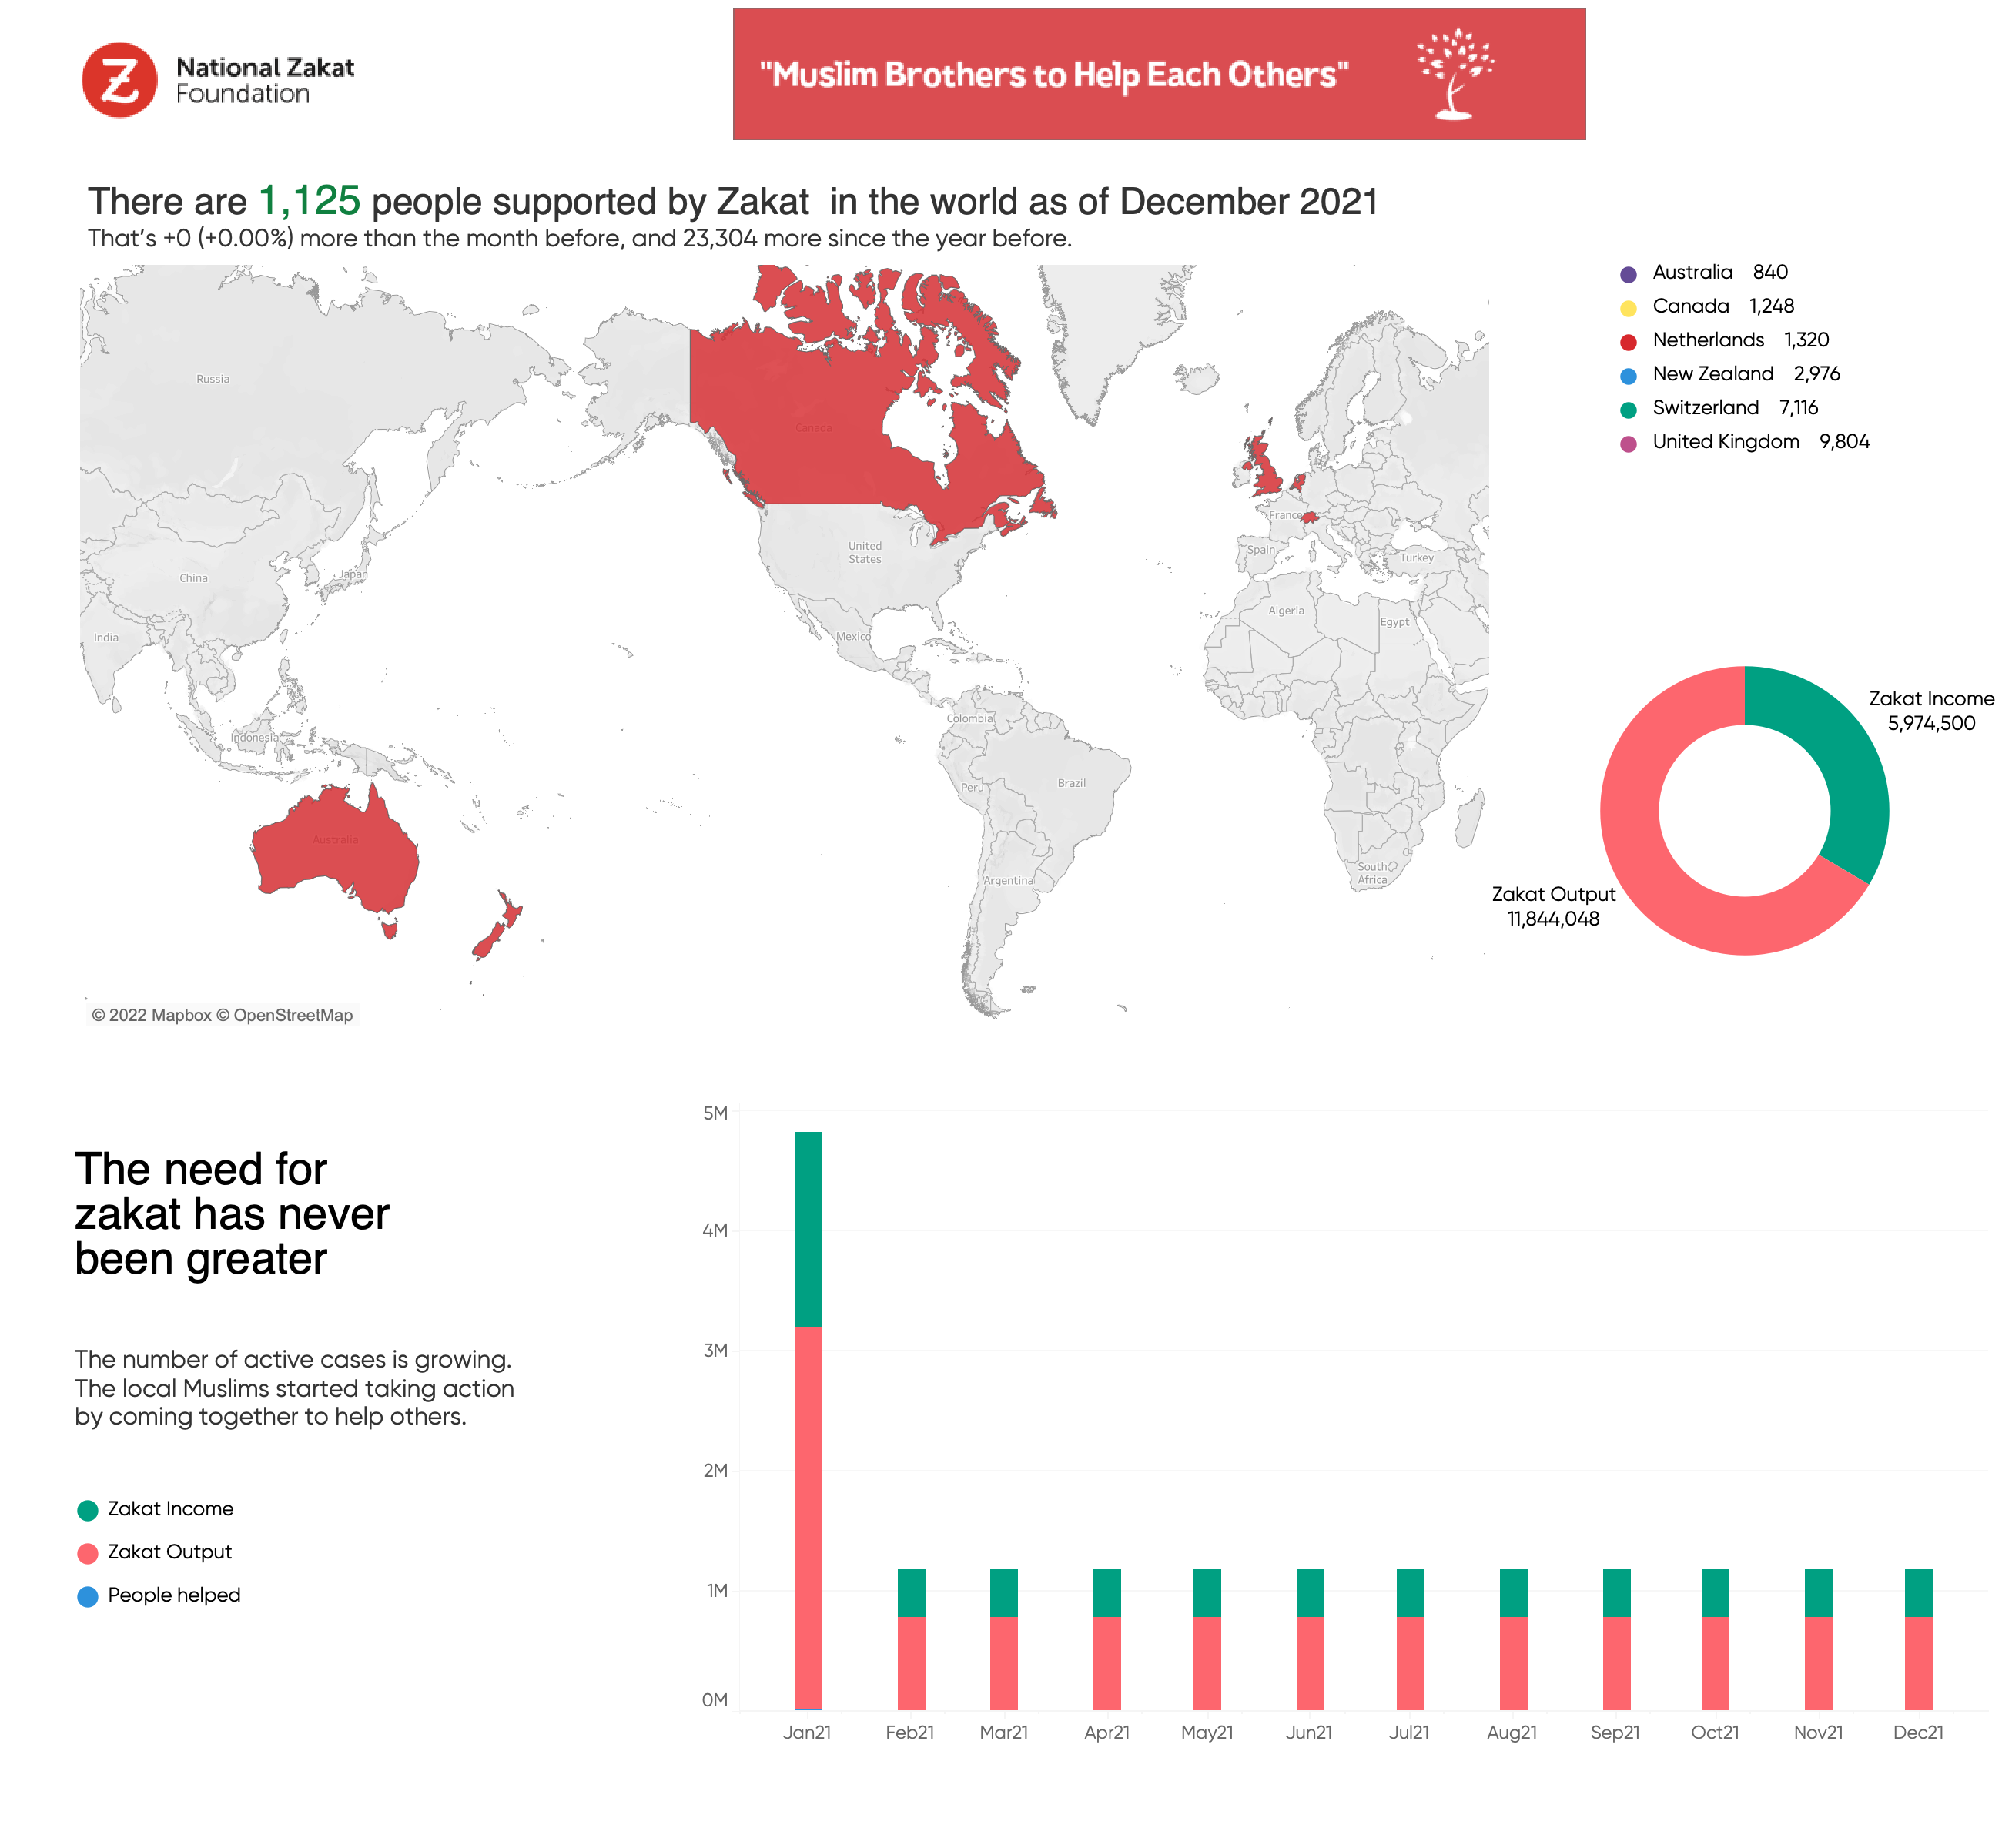
Created world map visualization showing donation sources by country (UK, Australia, Canada, Netherlands, New Zealand, Switzerland)
Built Zakat Income vs Output donut chart showing fund allocation
Designed time-series chart showing People Helped growth from Jan-Dec 2021
Added storytelling element: "The need for zakat has never been greater"
Made dashboard shareable for donor communications and annual reports
✓The Impact
People supported worldwide (tracked in real-time)
Zakat Income visualized for transparency
Year-over-year growth in people helped
Technology Stack
Project Details
Client
National Zakat Foundation
Industry
Nonprofit & Social Impact
Duration
3 weeks
Want to achieve similar results for your nonprofit & social impact organization?