Contact Center Performance Dashboard
Key Results
Incoming calls tracked with full analytics
Average talk time now monitored
First Customer Resolution rate visibility
1The Challenge
Contact center management had limited visibility into agent performance, call handling times, and customer satisfaction. Reports were generated manually and couldn't identify which agents needed coaching or which call types were causing bottlenecks.
2Our Solution
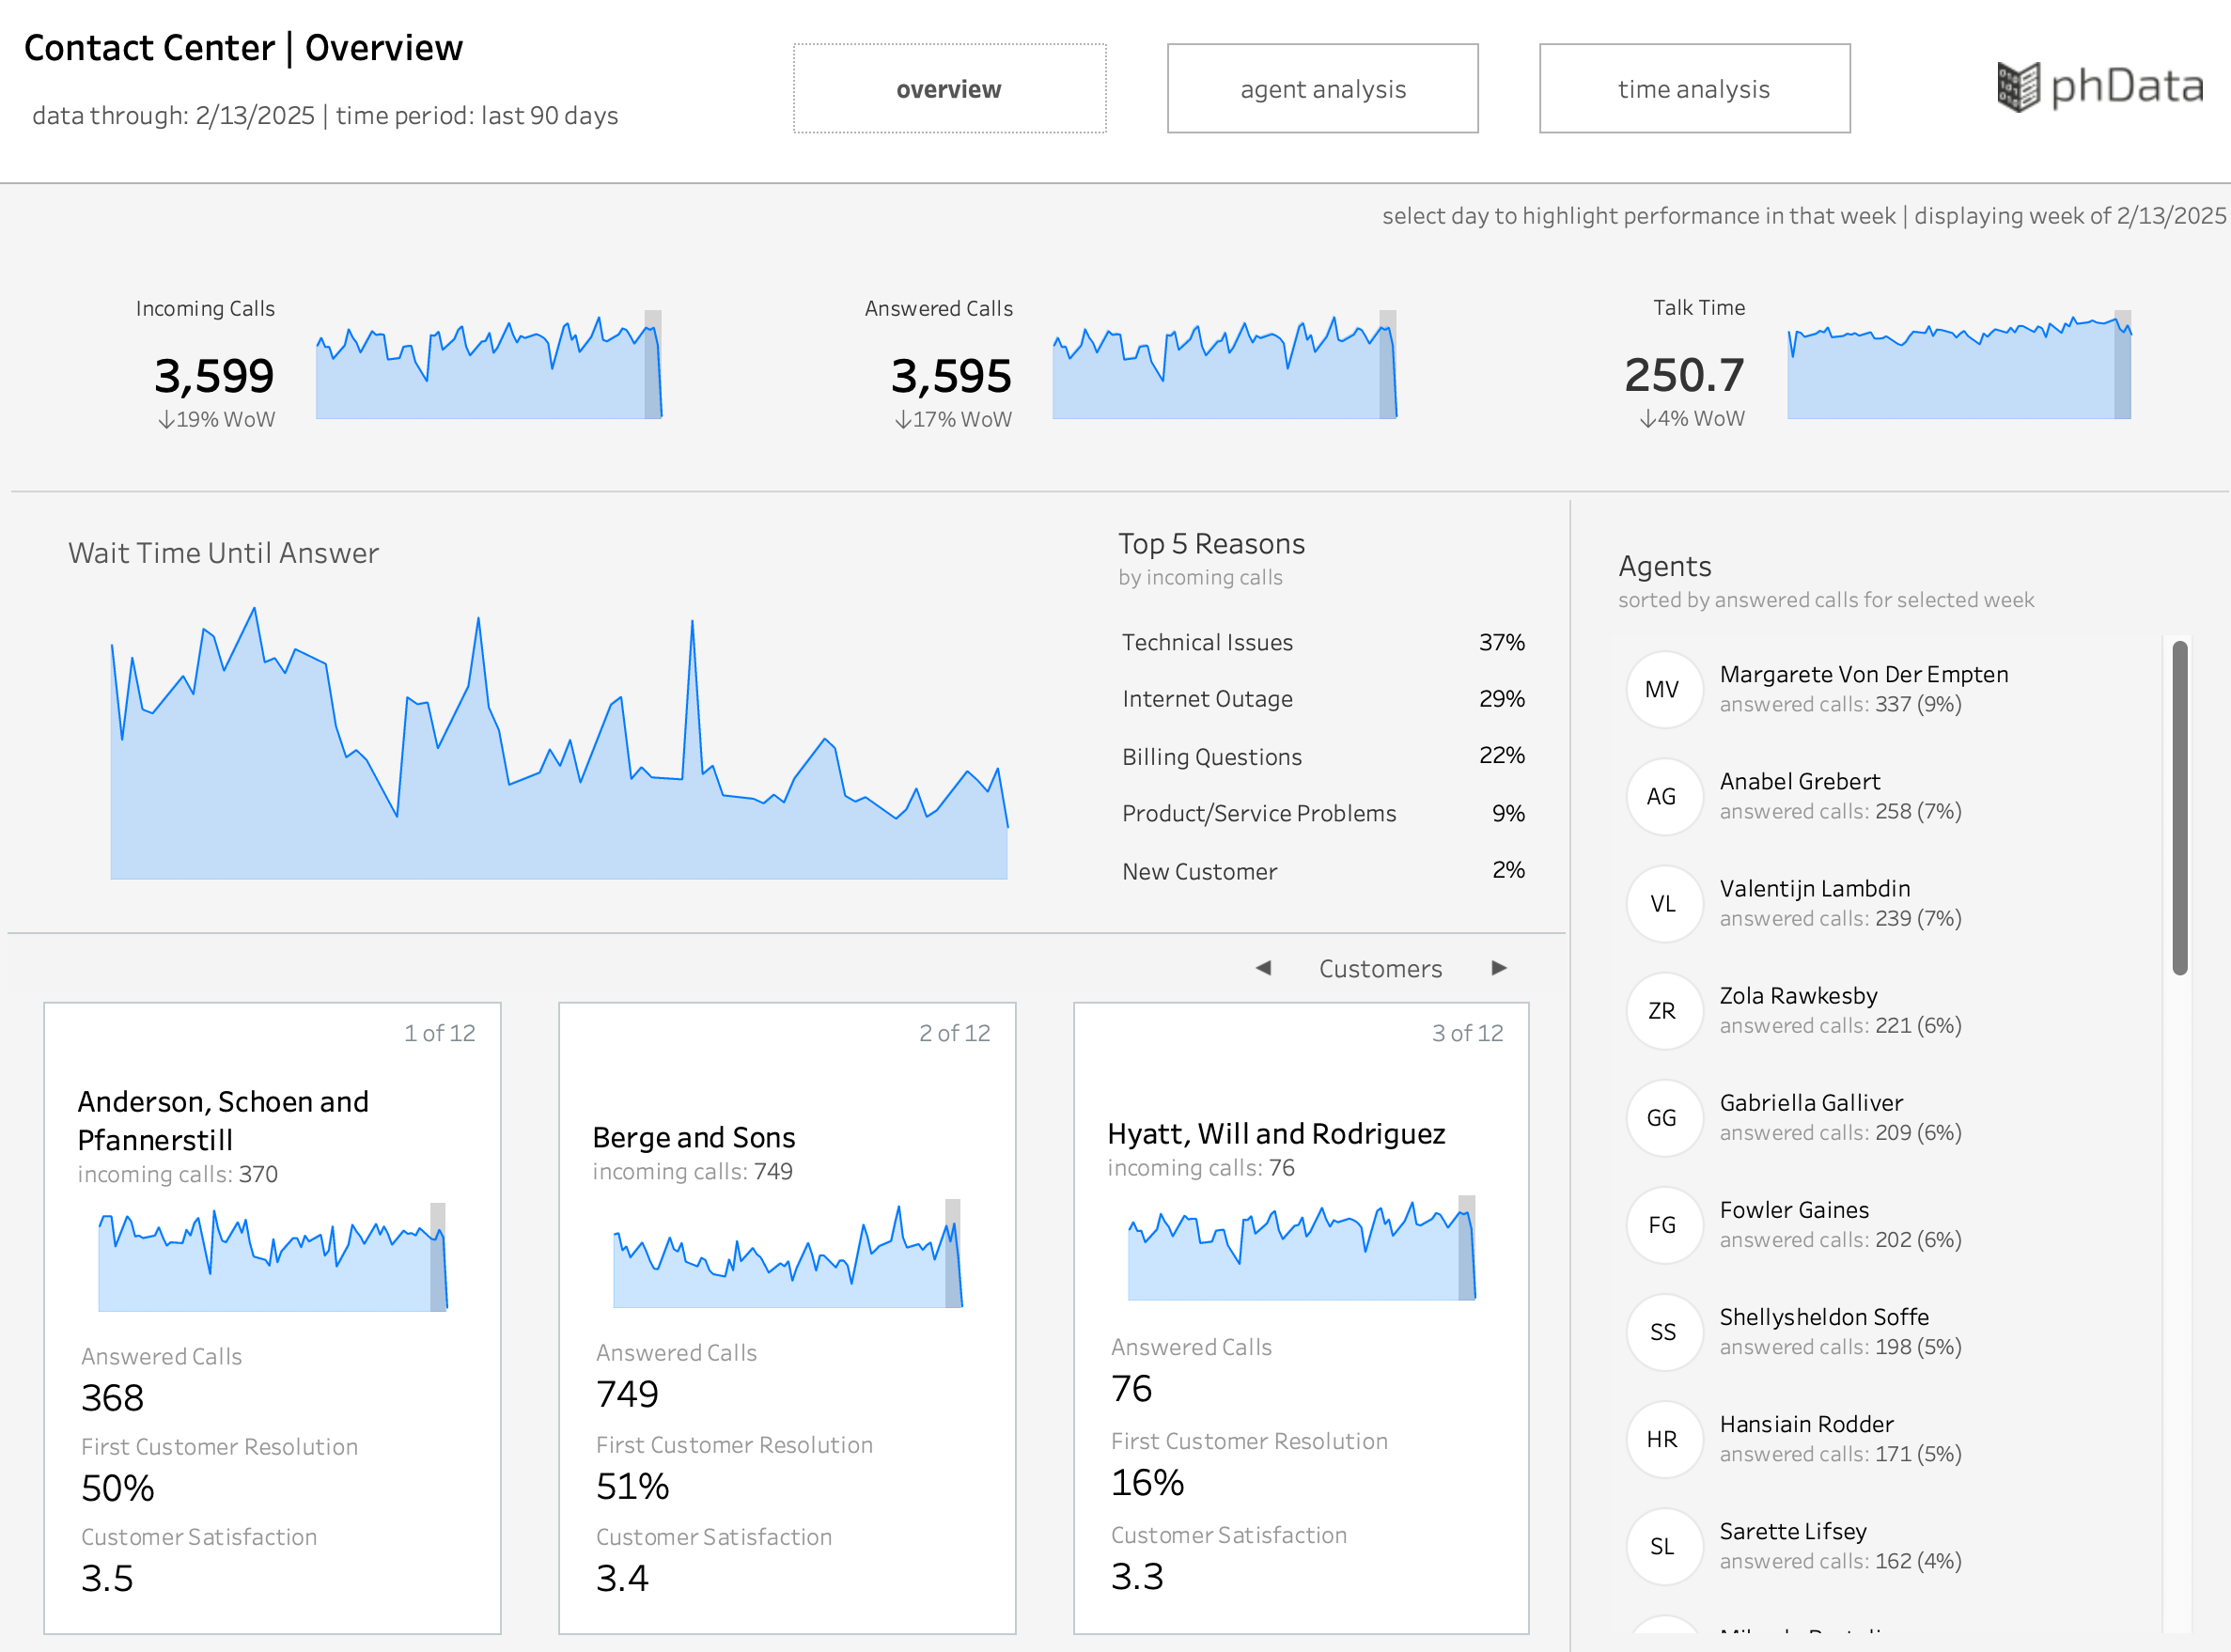
Built a comprehensive Contact Center Overview dashboard with real-time views of call volume, wait times, top call reasons, agent performance rankings, and customer-level drill-downs for quality assurance.
Our Approach
Designed Overview tab showing Incoming Calls, Answered Calls, and Talk Time metrics
Built Wait Time Until Answer trend visualization for capacity planning
Created Top 5 Reasons analysis (Technical Issues 37%, Internet Outage 29%, etc.)
Implemented Agent Performance sidebar with calls answered and rankings
Added Customer-level view with resolution rates and satisfaction scores per client
✓The Impact
Incoming calls tracked with full analytics
Average talk time now monitored
First Customer Resolution rate visibility
Technology Stack
Project Details
Client
phData
Industry
Contact Center
Duration
4 weeks
Want to achieve similar results for your contact center organization?