School Excellence & Network KPI Dashboard
Key Measurable Results
Unified across Occupancy, Retention, CRM, Labor, CTO & Surveys
Automated School vs. District vs. Company benchmarking
Weekly & monthly executive scorecard across all campuses
1The Problem
Leadership across the multi-location school network had no unified view of campus performance. District managers couldn't compare weekly occupancy, student retention, family survey recommendations, labor ratios, CRM inquiry-to-enrollment conversion, or contribution to overhead (CTO) side-by-side against district and company goals.
2What We Built
Built an automated School Excellence Report dashboard comparing every campus against District and Company averages across 8 core KPIs—Weekly Occupancy, 12-Month Retention, Family Survey Recommendation, Top Workplace Engagement, Monthly Labor %, CRM Inquiry-to-Enrolled Conversion, Monthly CTO, and Weekly Enrollment—with weighted composite scoring.
The Tools & How We Used Them
Power BI / Tableau
Designed the 8-panel School Excellence Report with synchronized trend lines, target badges, and 3-tier benchmark bars
SQL & Data Modeling
Aggregated weekly occupancy, rolling 12-month retention, monthly labor/CTO financials, and bi-annual survey datasets
CRM Analytics
Tracked monthly inquiry-to-enrolled conversion rates and enrollment count variances against campus goals
Automated Scoring Engine
Calculated composite campus, district, and company scores across weighted operational and financial KPIs
How It Works — Step by Step
Implemented a weighted Excellence Score rubric (Occupancy = 2 pts, CRM Conversion = 2 pts, CTO = 3 pts, Retention/Surveys/Labor = 1 pt each) benchmarking each school against District and Company averages
Built side-by-side multi-year trend lines and current-period comparison bars for Weekly Occupancy, 12-Month Retention, and Weekly Enrollment
Integrated CRM Inquiry-to-Enrolled conversion tracking with dual percentage and enrollment-count goal thresholds
Added financial and operational health cards tracking Monthly Labor % against target thresholds and Contribution to Overhead (CTO) across positive, average, and goal benchmarks
✓The Result
Unified across Occupancy, Retention, CRM, Labor, CTO & Surveys
Automated School vs. District vs. Company benchmarking
Weekly & monthly executive scorecard across all campuses
Skills & Deliverables
Project Details
Our Role
Senior BI Analyst
Client
New Horizon Academy
Industry
Education
Delivery Timeline
4 weeks
Need a similar system built for your team?
Book a free discovery call and we'll map out how to build this for your exact data sources and tools.
More Education Case Studies
View All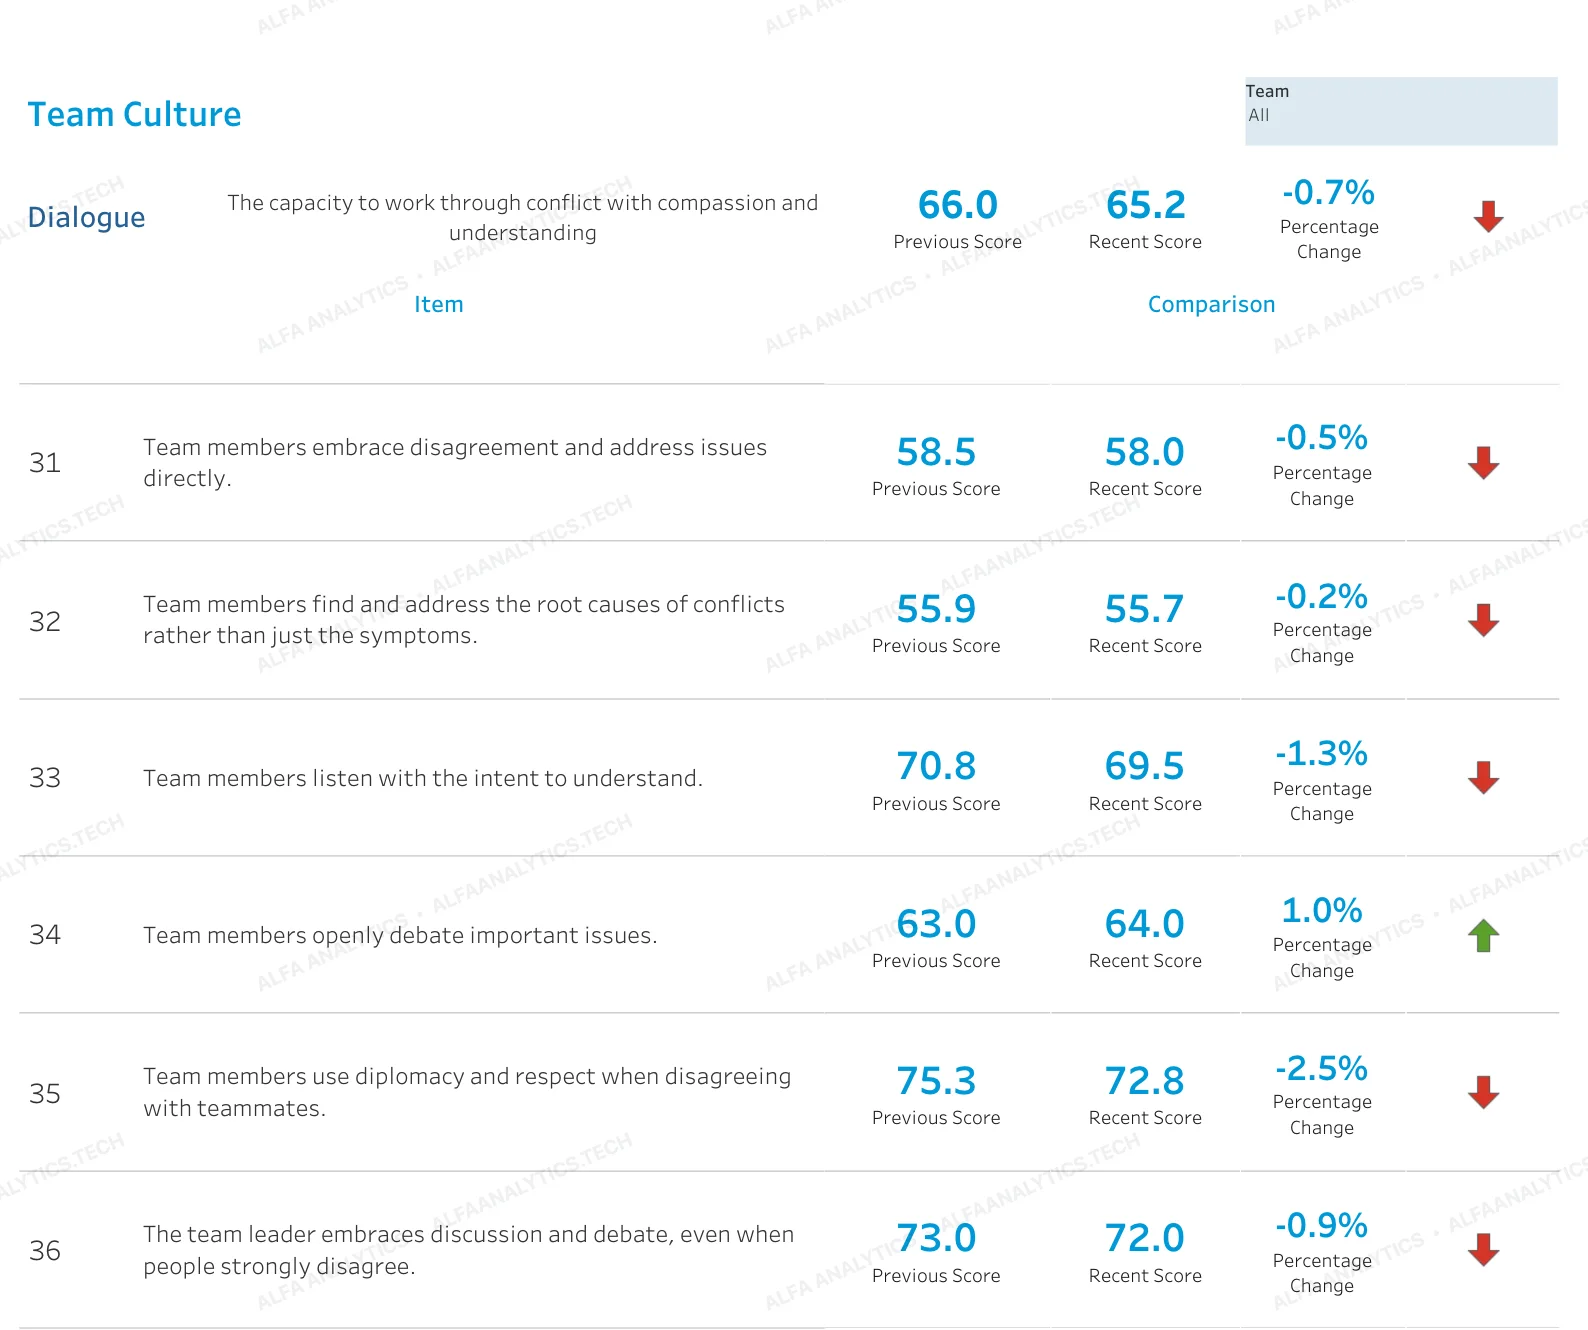
Team Culture & Executive Coaching Scorecard
Executive coaches needed a clear, quantitative way to measure team culture over time and prove whether leadership coaching engagements were actually improving communication and conflict resolution across client teams.
View Case Study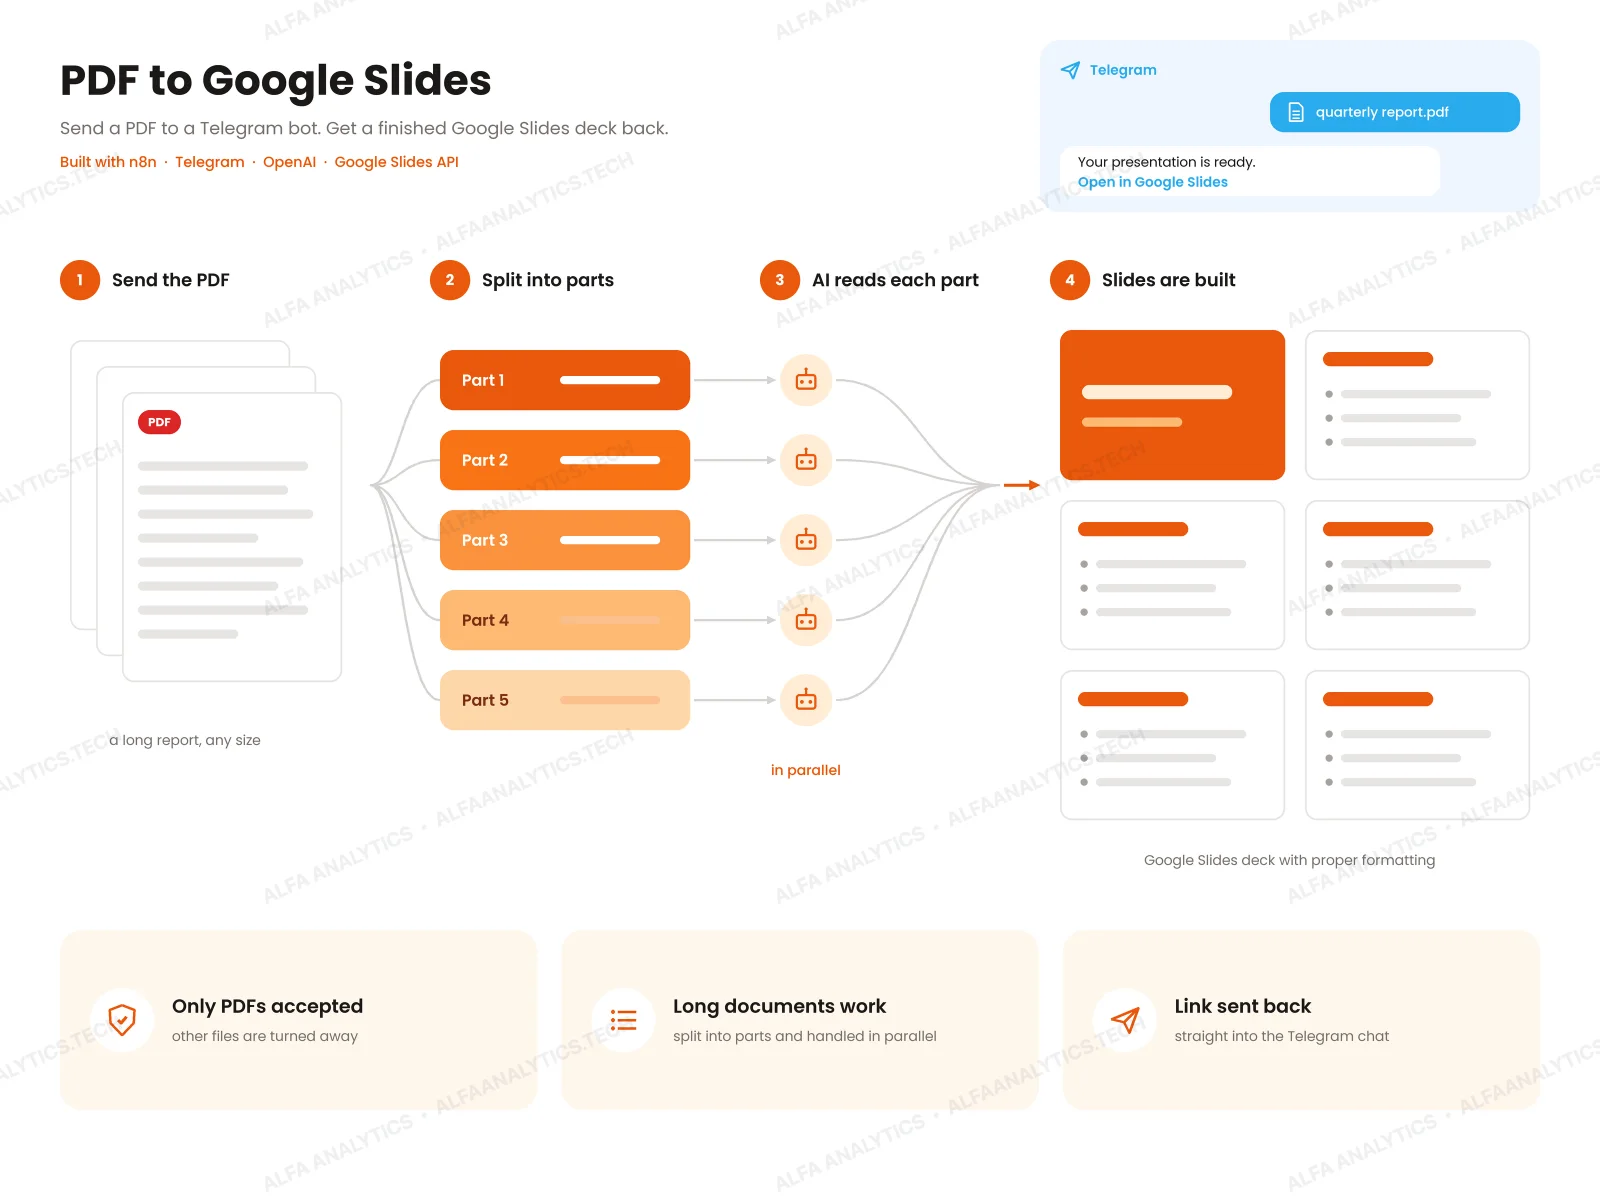 Video
AI PDF to Google Slides Converter (Telegram Bot)
The client frequently had to turn long PDF reports into presentation decks under tight deadlines. Reading the entire document, pulling out key takeaways, and formatting every slide by hand took hours—and the longer the PDF report, the longer the bottleneck.
View Case Study