Portfolio

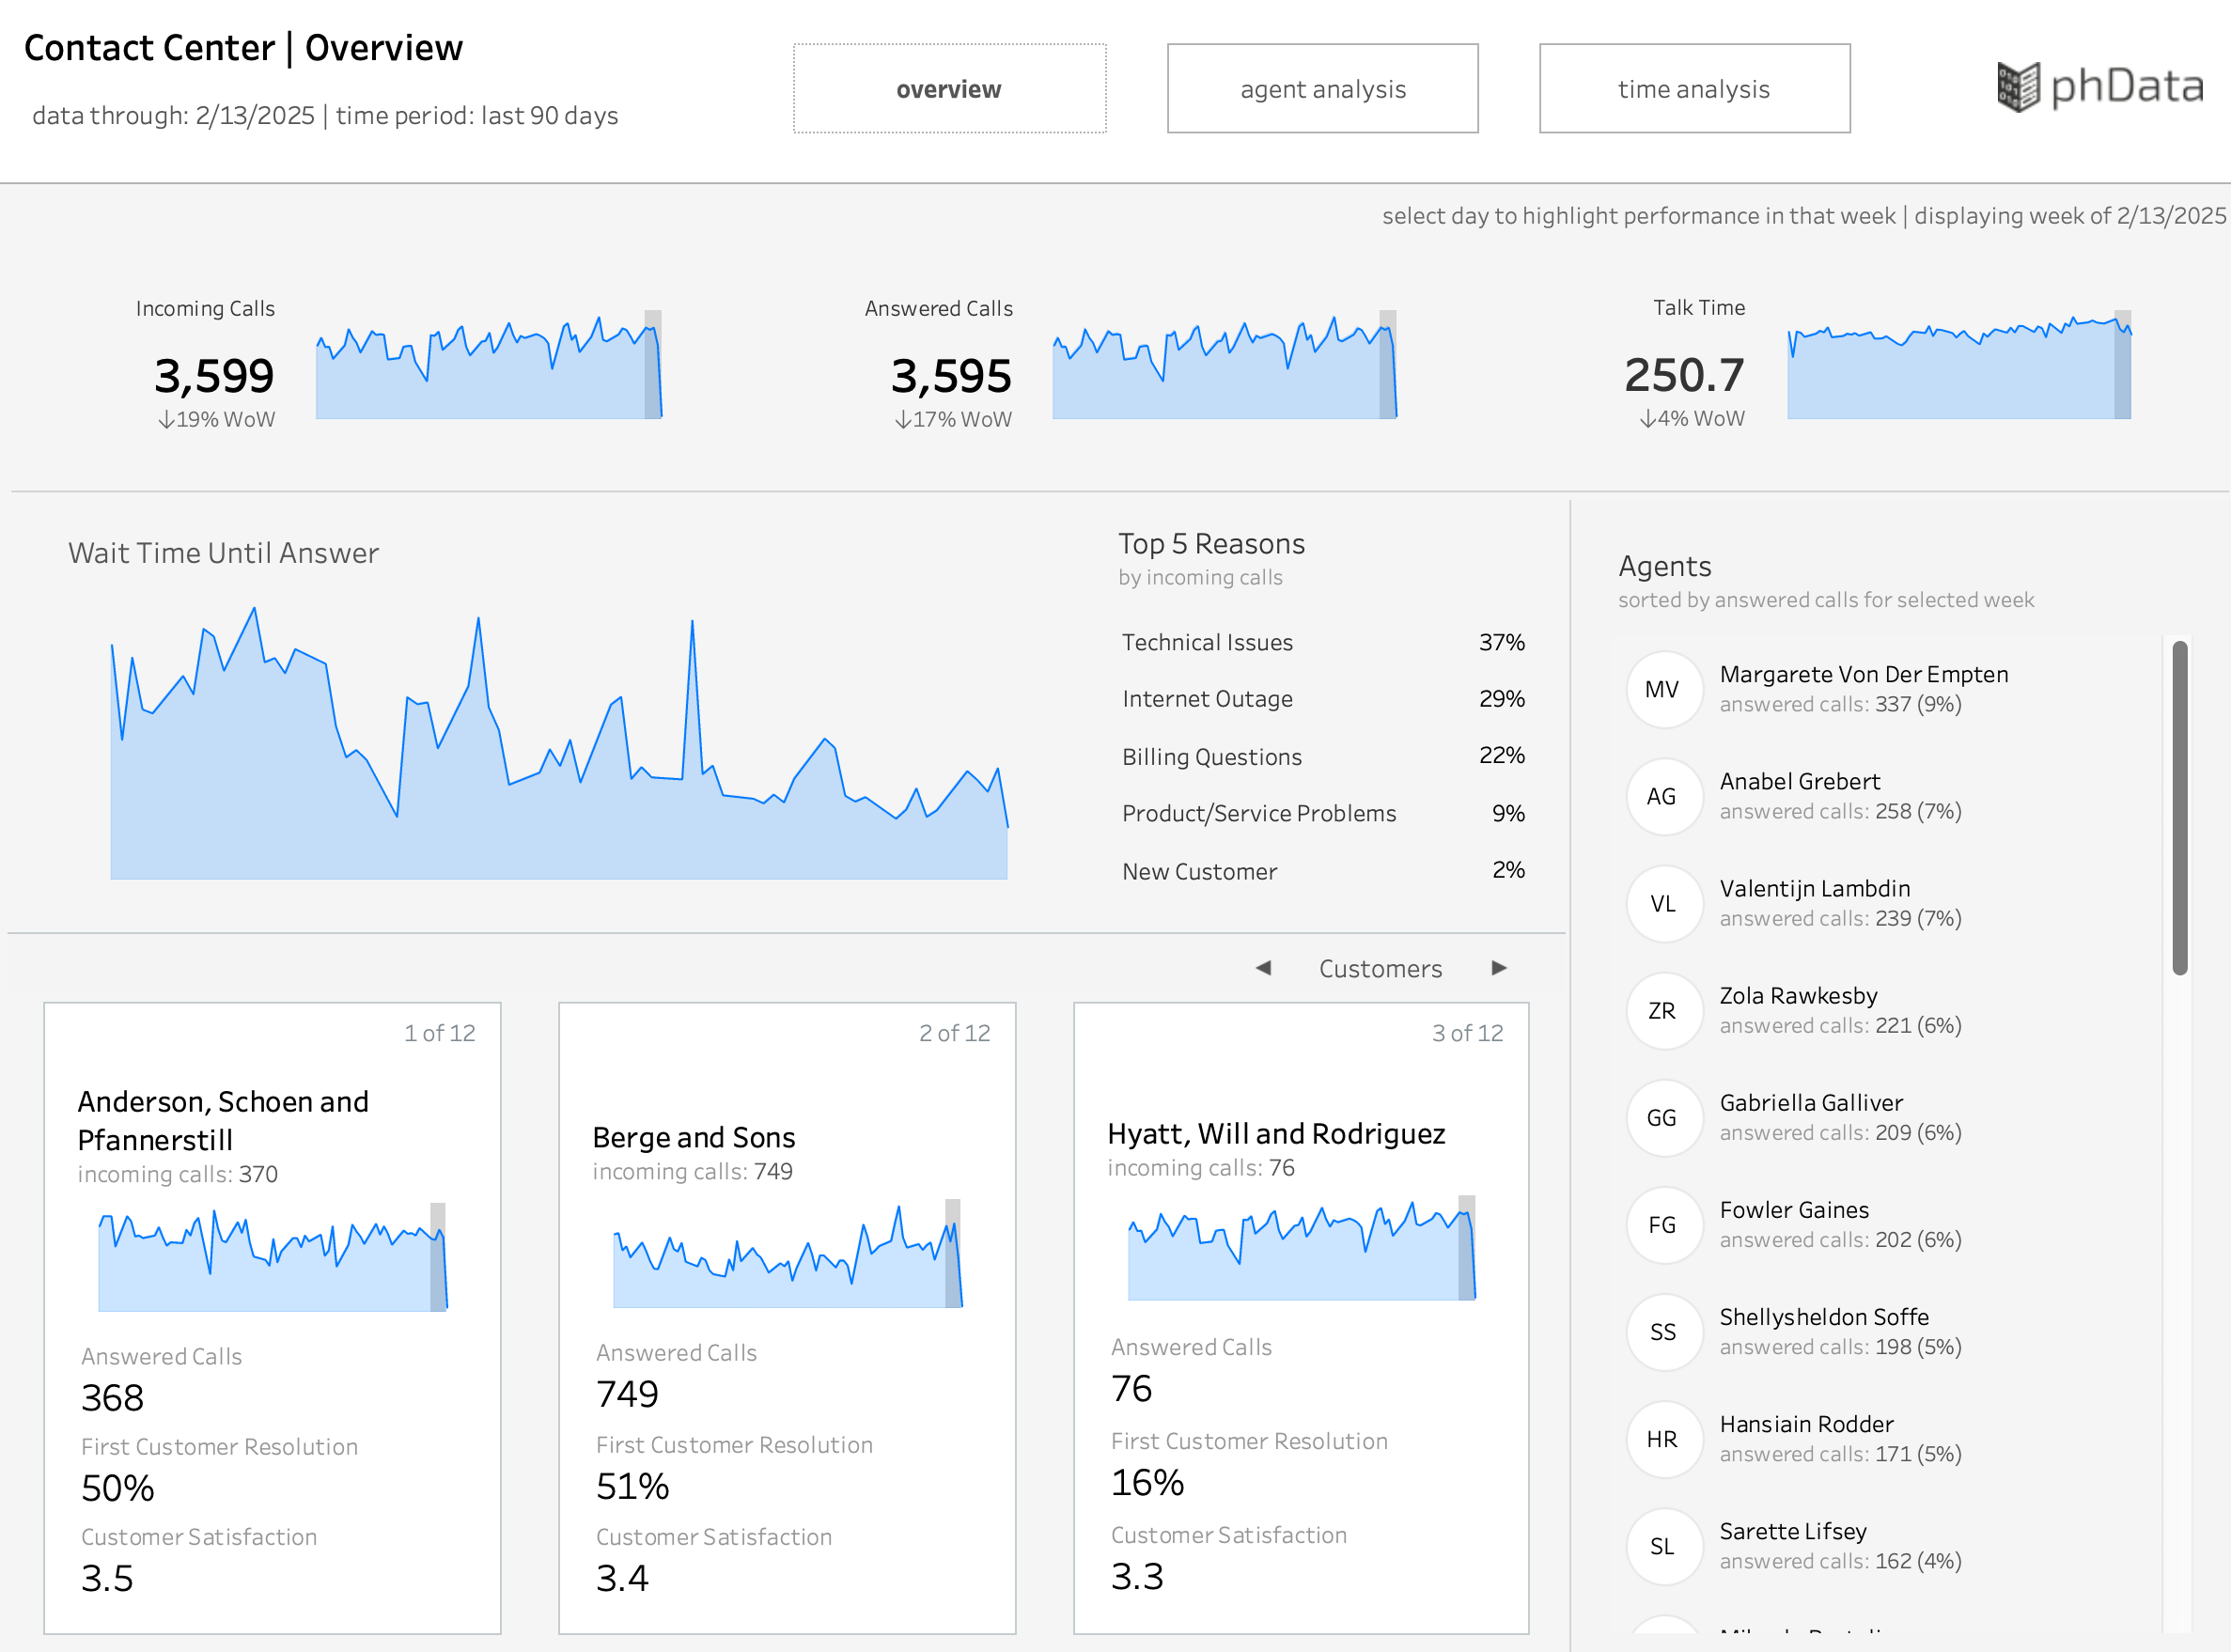
Contact Center
This contact center dashboard provides a clear, data-driven overview of weekly call center performance, focusing on key metrics such as incoming and answered calls, average talk time, wait time until answer, top call reasons, agent performance, and customer-level resolution statistics. Built in Tableau, the dashboard leverages day-level call data that is aggregated to a weekly level using calculated fields and date truncation functions. Data modeling was performed to structure fact tables (calls) and dimensions (agents, customers, reasons) efficiently, enabling accurate joins and performance-optimized visualizations. The result is an interactive and actionable view that supports operational monitoring and performance evaluation across agents and customer accounts.


Tab 1: Executive Metrics - Industry & Category Insights
This dashboard provides a high-level view of consumer spending behavior derived from credit card transaction data. Key metrics such as Spend Per Buyer, Frequency Per Buyer, Average Transaction Value (ATV), and Loyalty % give an immediate pulse of market engagement across time. Visuals like Share of Wallet by Category, Percent Change from Prior Years, and ATV Trends by Category allow users to identify which categories (e.g., Gas Stations, Beauty Products, Shopping) are experiencing the highest growth, retention, and transactional volume. Dynamic filtering by age, gender, category, and time period enables granular exploration. This dashboard helps stakeholders pinpoint sectors with increasing consumer engagement supporting data-backed investment decisions.

Tab 2: Brand Comparison – Competitive Intelligence View
The Brand Comparison dashboard compares detailed consumer behavior metrics across two selected brands (e.g., Google vs. Apple), including Market Share, Loyalty %, ATV, Incidence Rate, and Repeat Purchase Rate. The dashboard further segments average spend across time buckets (0–3 months, 3–6 months, etc.) and visualizes Leaked Dollar Attribution, showing which competitors are gaining spend from the brand in focus (e.g., Facebook, Amazon, Twitter). A geographic breakdown of spend adds regional insight. This dashboard empowers investment analysts and marketers to assess brand-level performance and consumer shift patterns, crucial for identifying emerging market opportunities and competitor risks.


E-Commerce RFM Segmentation Dashboard
The RFM Segmentation Dashboard helps businesses analyze customer behavior based on Recency (R), Frequency (F), and Monetary (M) values to improve retention and revenue growth.
Key Benefits:
🔹 Identify High-Value Customers – Engage your most profitable customers.
🔹 Detect At-Risk Customers – Reactivate those losing interest.
🔹 Optimize Marketing Efforts – Personalize outreach for better conversions.
🔹 Understand Seasonal Trends – Spot recurring and one-time buyers.
🔹 Enhance Decision-Making – Gain insights to refine pricing and promotions.

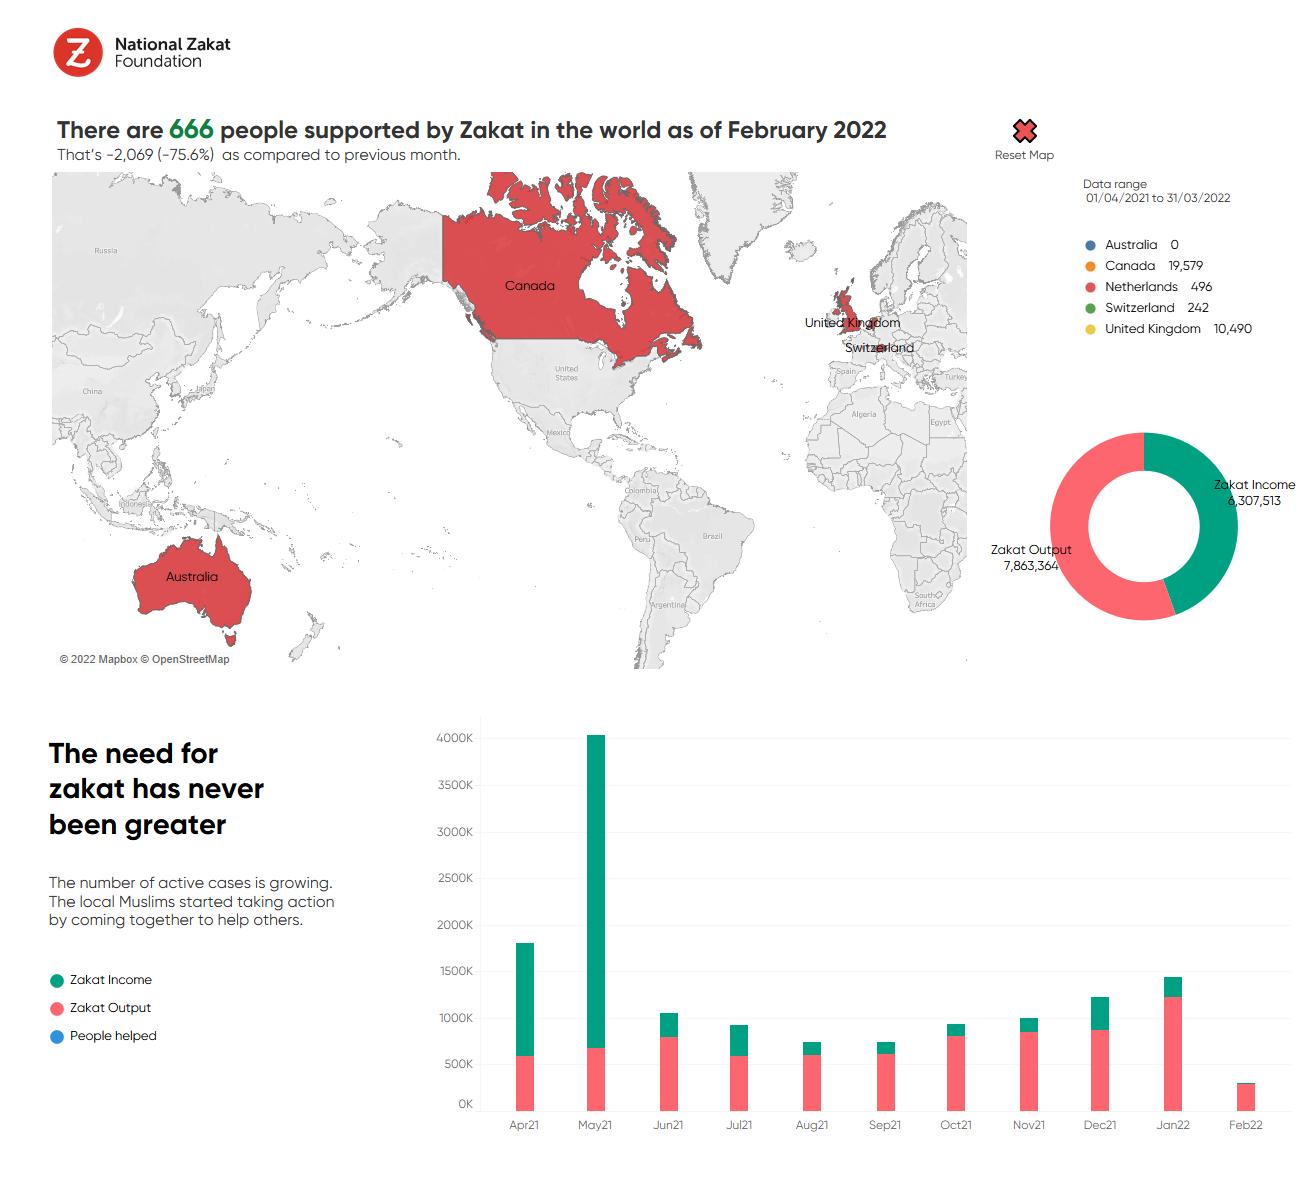
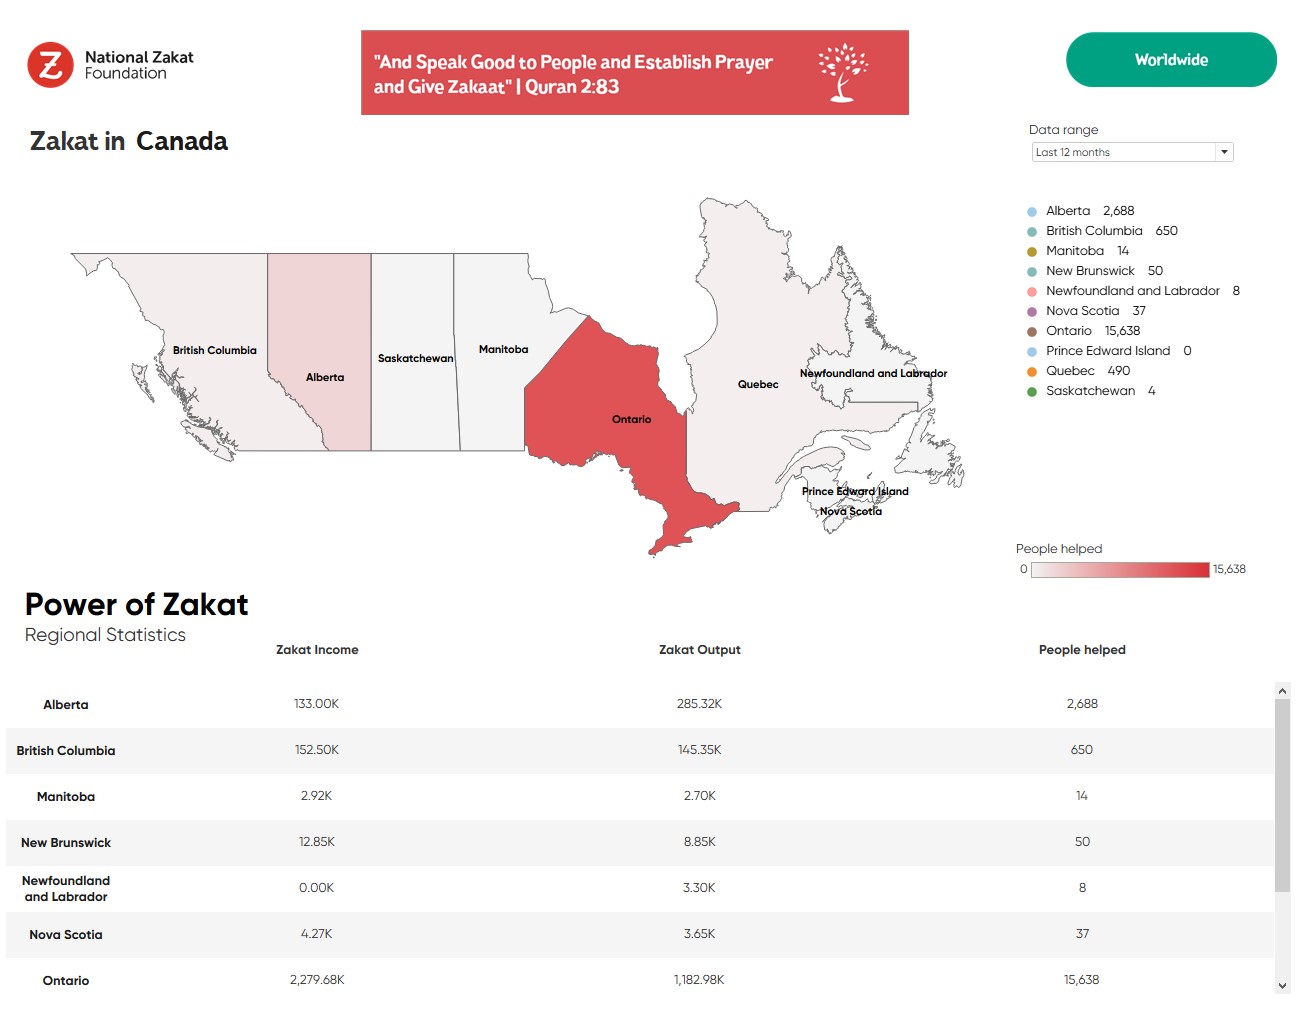
National Zakaat Fund
NZF wanted to see the number of people helped with zakat in the United Kingdom and other Eastern countries with their unstructured data. We choose tableau to see those statistics in an amazing intuitive dashboard. The custom fonts and color codes added a sleek effect to the visuals. This dashboard is highly interactive and upon interacting with the countries on the map the tableau takes the user to the next dashboard where he can see the regional distribution of that country with a detailed view. The dashboards really helped the client to represent the status of zakat distribution and also compare how they are improving with respect to last month and year.

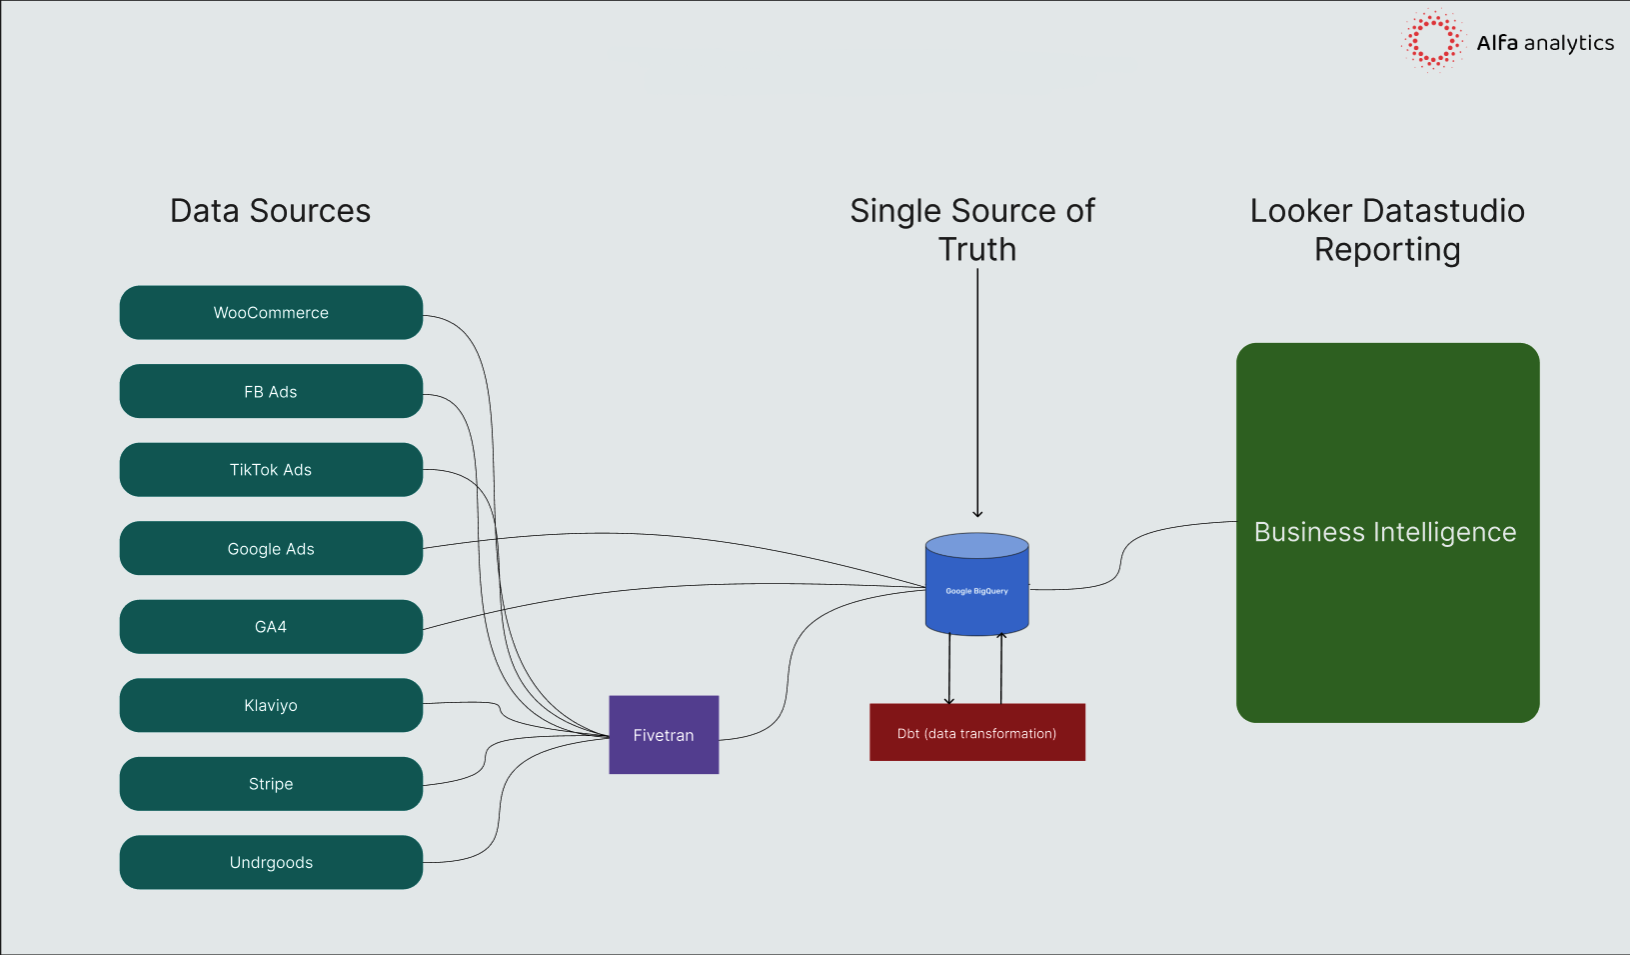
Marketing ELT Pipeline using Fivetran, Bigquery, SQL, DBT and Looker
The client has data coming from multiple social media platforms and wanted to have a consolidated point of truth. For that, we came up with an approach that will have an automated end-to-end data pipeline and will cover all the client data and reporting needs.